R Consortium talked with Jared Lander about the R Community in the New York Metro area. The R Community’s ability to draw upon not only their large metro area as well as their status as a hub city has allowed them to have many different speakers. This has allowed them to grow the community to an impressive size.
RC: What is the R community like in New York?
We are not just the City, but we have a broad reach. We have an active and vibrant community that is very enthusiastic. From Brooklyn Hipster data scientists with MacBooks riding a fixie [Editor’s note: A type of bicycle with just one gear, considered cool and stylish], office workers in slacks and ties just off from work, and everything in between.
Old school data scientists who consider themselves hardcore statisticians, people just learning the field, people with 30 years of experience, people with one-year experience dipping toes into a different field, we have so many people, the topic of the meeting determines who shows up. If we have a finance talk we will give finance and insurance. Marketing topics will give marketing and business people. If we have a pharmaceutical talk we will get biologists and biostatisticians.
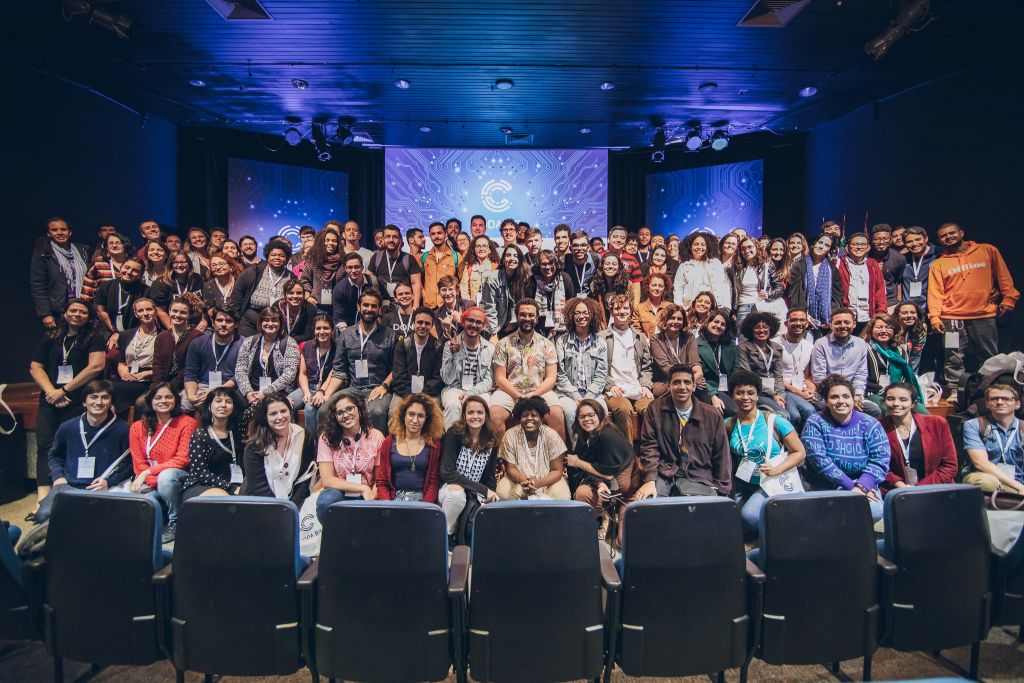
We also have talks on topics like racing, military, doctors, and lawyers. We have talks and members from all walks of life. We have over 12,200 members. We usually have a core group that shows up to meetings, but others will come because a topic speaks to them. Some won’t come for 6 months till another topic interests them. Attendance comes down to the meeting.
RC: How has COVID affected your ability to connect with members?
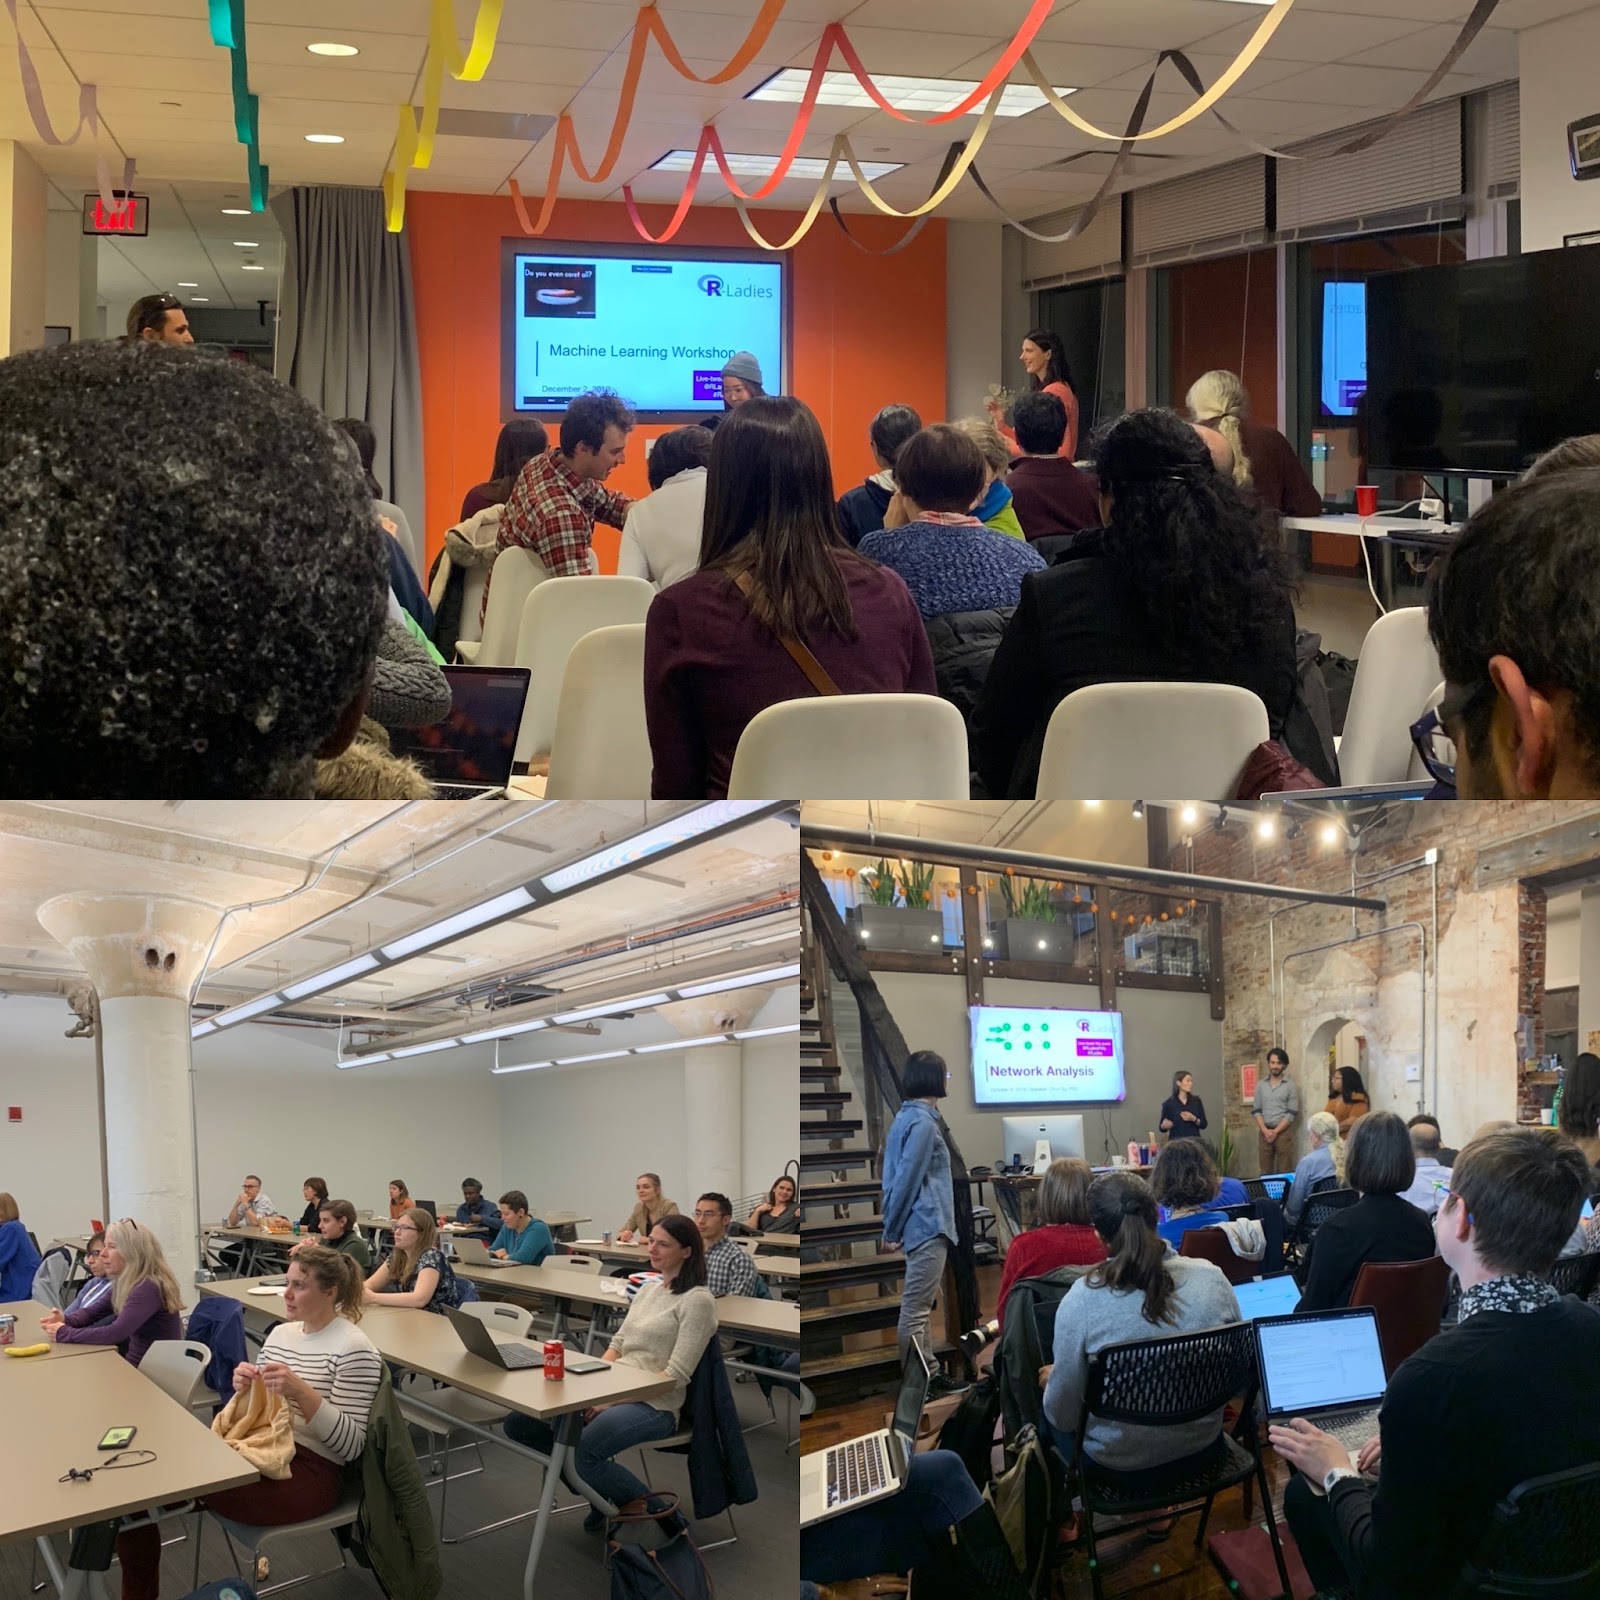
We lose the in-person connection. We usually have people show up at 6:15-6:30pm for pizza and (budget allowing) drinks. Usually, people meet for 30 or 40 minutes and talk/socialize and start making friends. We have a speaker go on for 45 minutes or so. We then went to the bar to hang out about whether or not they drink. We get a great lecture, the best night school, that’s free, sandwiched between hanging out with people who are interested in your field or something close to your field.
Even though we are missing out on that, we are meeting every month. We are having Zoom fatigue because we are losing people. So we do clearly lose out on that social interaction. In-person meetings can have several people having a chat, while a Zoom meeting can only have, at most, two people talking at a time. It becomes a one-way lens.
People will chat in a Slack room where people can ask their questions. However, I preferred the in-person where people could nod to show understanding or sit next to people and whisper to them. We are missing out on that.
We were interested in using gather.town and spatial.chat, but were unable to. Due to meetup.com restrictions, we are forced to use Zoom.
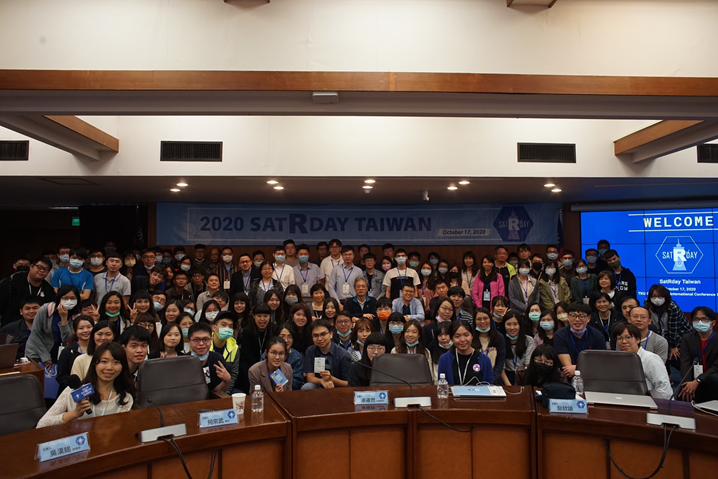
However, the nice thing about going virtual is that we got a worldwide attendance from those who wouldn’t otherwise be able to attend.
Going forward, we will have the in-person meetup (hopefully soon) and Zoom as well. This way, people can participate online and via Slack as well as in person. People can also access all of our meetings via our website or our YouTube channel.
RC: Can you tell us about one recent presentation or speaker that was especially interesting and what was the topic and why was it so interesting?
Will Landau wrote the drake package and the targets package. Targets is a real game changer at my work. It makes my life so much easier as it looks at dependencies to not rerun redundant processes and parallel processes tasks. I was able to get Will to give a speech after he attended another meetup. I have done that several times actually, where people who wrote packages attended, and I have been able to get them to do future meetups.
RC: What trends do you see in R language affecting your organization over the next year?
It’s getting more respect. People are starting to learn that R is a full production language, and I have used it in many sectors. We are getting more people who are learning it for a job, and they come and visit us, and they learn that there is more to it.
RC: Do you know of any data journalism efforts by your members? If not, are there particular data journalism projects that you’ve seen in the last year that you feel had a positive impact on society?
We have a lot of members who are journalists who either use data to figure out what’s going on and/or use data to inform their readers. We have members from AP Press, NY Times, Wall Street Journal, Bloomberg, and more. It’s so cool seeing this because they want to use data to find out what’s going on. They love it, and it’s so great to see these people who are using the code to find the outcome.
RC: When is your next event? Please give details!
Our next meetup is on June 15 is a talk by Emil Hvitfeldt who is going to talk about text mining. The July 13 is by Sean Taylor with no topic chosen yet.
RC: Of the Funded Projects by the R Consortium, do you have a favorite project? Why is it your favorite?
SFDBI because I do a lot of geospatial work. I have always asked people if I can work with geospatial data in postGIS, I can use geospatial data in R, can I use postGIS in R and I’m hoping that I can do it in R now.
RC: Of the Active Working Groups, which is your favorite? Why is it your favorite?
Distributing computing. Most things don’t need it, but we had a speaker who worked on Ballista (now merged with Arrow Datafusion) which is a language-agnostic distributive computing program that could be integrated into R. This could force people like NVidea to port CUFD to R.
How do I Join?
R Consortium’s R User Group and Small Conference Support Program (RUGS) provides grants to help R groups around the world organize, share information and support each other. We have given grants over the past 4 years, encompassing over 65,000 members in 35 countries. We would like to include you! Cash grants and meetup.com accounts are awarded based on the intended use of the funds and the amount of money available to distribute. We are now accepting applications!