All Posts By

R Consortium

R-Ladies Rome: Empowering Women in Data Science Through Collaboration and Innovation

By Blog

Federica Gazzelloni, co-organizer of R-Ladies Rome, recently spoke with the R Consortium about the fast-growing R community in Rome. The group collaborates with R user groups worldwide and has successfully attracted a diverse audience to its events. Federica also contributes to the R community through package development and is currently working on a book about using R for health metrics and tracking the spread of infectious diseases.

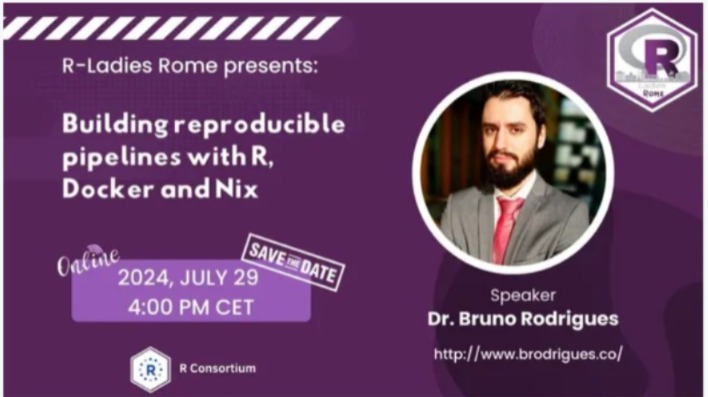
The group is hosting an online event titled “Building Reproducible Pipelines with R, Docker, and Nix” on the 29th of July. R users from around the world are invited to attend this event.

Please share about your background and involvement with the RUGS group.

I am Federica Gazzelloni, an actuary and statistician interested in health studies. I am writing a book about health metrics and the spread of infectious diseases. As the lead organizer of R-Ladies Rome, one of the R user groups sponsored by the R Consortium, I am grateful for the support that enables us to organize monthly talks, tutorials, and workshops. Our events provide an inclusive and accessible learning environment free of charge, featuring exciting speakers and various engagement opportunities. Additionally, we have held events in partnership with R-Ladies New York, R-Ladies Paris, and Tunis R User Group and created a branded website: rladiesrome.org!

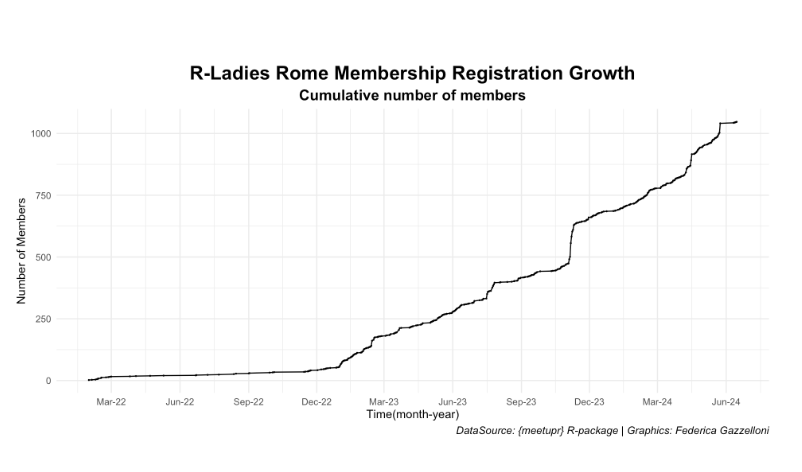
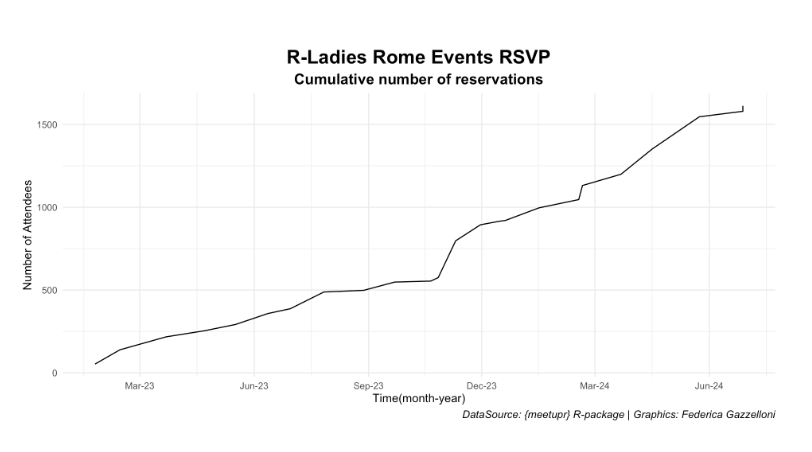
R-Ladies Rome started in 2023 and has grown significantly since then. Our events consistently reach a substantial audience. For instance, our latest event with Isabella Velasquez garnered over 100 RSVPs. During Data Viz Month, we received unexpected attention from the open tech community of learners. Our followers on Meetup have reached over 1.1k, and our social media presence is steadily growing.

Can you share what the R community is like in Rome? 

Since the kick-off of the chapter in 2023, R-Ladies Rome has played a pivotal role in fostering a dynamic community. We have successfully brought together an international group of R enthusiasts, ranging from beginners to experienced data scientists, creating a supportive and engaging environment for all. The popularity of the R language within the open source community, particularly for statistical analysis and medical research, is evident in Rome. R offers a wide range of libraries that can be easily applied to various topics, making it very convenient for users. Although Python is gaining attention in research and providing another accessible option for statistical analysis, the medical statistical community seems to prefer R over Python due to its extensive capabilities and strong community support.

Our events have consistently attracted significant attention and participation. For example, our latest event with Isabella Velasquez garnered over 100 RSVPs. We have also received unexpected attention during Data Viz Month from the open tech community of learners. Our Meetup followers have reached over 1.1k, and our social media presence is steadily growing.

The R community in Rome is expected to grow, with R-Ladies Rome at its heart, driving engagement and promoting the use of R for various applications. We are excited to continue growing and evolving, providing valuable learning opportunities and fostering connections within the community.

What trends do you currently see in R language?

We have reviewed all the events that R-Ladies’ groups have organized in the past years and, after considering the rebranding of RStudio to Posit PBC and RMarkdown to Quarto, realized that several exciting trends in the R language are shaping its usage and development within the data science community. Analyzing event titles, attendee numbers, and activity on past recordings, we found that events containing “Introduction” or “Tutorials” impact learners most, highlighting the growing interest in learning R for data analytics, reproducible research, and dynamic reporting.

Moreover, integrating R with other programming languages and platforms is gaining significant attention. The interoperability between R and languages like Python, HTML, or Java allows users to enhance their skills across multiple tools within a single environment. This has expanded R’s capabilities, making it a versatile choice for a diverse range of users.

Any techniques you recommend using for planning for or during the event? (Github, zoom, other) Can these techniques be used to make your group more inclusive to people that are unable to attend physical events in the future?

We’ve been using Canva extensively for various tasks and found ChatGPT very helpful in crafting storytelling content. To enhance the planning and execution of events, Copilot assists with its excellent collaborative typing, saving time. Additionally, having a Meetup pro-account is valuable, mainly as R-Ladies Rome is part of the broader R Ladies group. It helps us connect with a wider audience while using Google Forms aids communication and prevents missing information. We also use YouTube and have our channel, which is very useful for sharing past events recordings and making them available online to ensure accessibility for those unable to attend live events. 
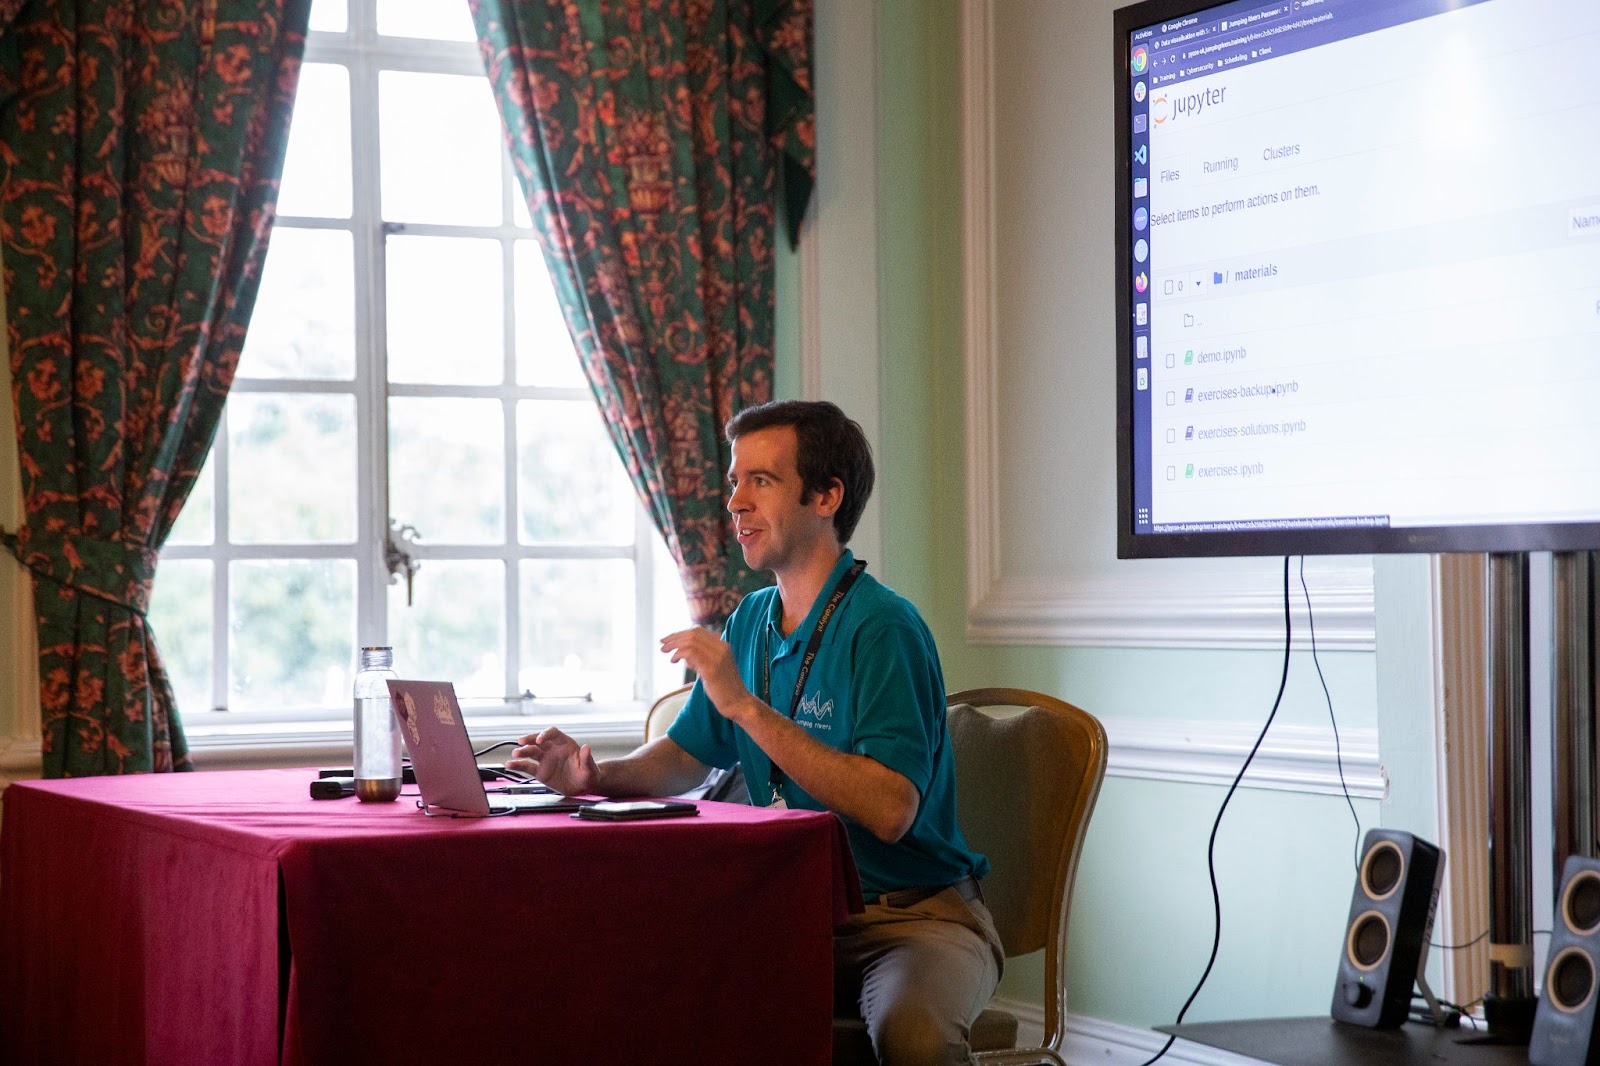
You have a Meetup on Building reproducible pipelines with R, Docker and Nix, can you share more on the topic covered? Why this topic? 

We have an upcoming Meetup titled “Building reproducible pipelines with R, Docker and Nix” , featuring speaker Bruno Rodrigues. This topic was chosen based on feedback from our organizers, Silvana Acosta and Rafael Ribeiro, who polled our audience to identify a favorite speaker. Bruno Rodrigues emerged as a popular choice, highlighting the growing interest in robust and reproducible data science workflows.

In this session, Bruno Rodrigues will guide us through setting up reproducible data pipelines using R, Docker, and Nix. These tools ensure that data analyses are consistent and can be easily shared and replicated across different environments. By learning to use Docker and Nix alongside R, our community members will gain valuable skills to enhance the reliability and reproducibility of their data science projects. This event aligns with our mission to provide practical and impactful learning opportunities that meet the evolving needs of the data science community.

Please share about a project you are currently working on or have worked on using the R language. Goal/reason, result, anything interesting, especially related to the industry you work in?

One of the key projects I am currently working on involves a quarto-book titled “Health Metrics and the Spread of Infectious Diseases with R”, which CRC Press will publish at the end of this year. This book aims to provide comprehensive insights into the intersection of health metrics, such as DALYs and infectious disease dynamics, using advanced statistical methods and machine learning techniques in R. The goal is to equip readers with the knowledge and tools to analyze and interpret health data effectively, thereby contributing to the broader field of public health.

In addition to the book, I have developed a couple of R data packages to aid in data analysis and visualization. One is “oregonfrogs,” which is expected to go on CRAN very soon. This package focuses on classification modeling for detecting frog habitats, utilizing spatial techniques. It provides a valuable function, longlat_to_utm(). The development of these packages showcases R’s versatility in handling complex ecological data and emphasizes the importance of open source tools in advancing scientific research. Through these projects, I aim to demonstrate the practical applications of R in public health and environmental science, fostering a deeper understanding and appreciation of data-driven methodologies.

How do I Join?

R Consortium’s R User Group and Small Conference Support Program (RUGS) provides grants to help R groups organize, share information, and support each other worldwide. We have given grants over the past four years, encompassing over 68,000 members in 33 countries. We would like to include you! Cash grants and meetup.com accounts are awarded based on the intended use of the funds and the amount of money available to distribute.

Empowering the R Community: Insights from Myles Mitchell of the Leeds Data Science Group

By Blog

The R Consortium recently interviewed Myles Mitchell, co-organizer of the Leeds Data Science group, to discuss the local R community and the group’s recent activities. Myles highlighted the group’s efforts to create an inclusive and welcoming environment for all participants. The group is dedicated to creating networking opportunities for students interested in pursuing a career in data science and sharing job openings.

The Leeds Data Science group is hosting an in-person event titled “Improving the Fidelity and Stability of Large Language Models” on the 23rd of July. 

Please share about your background and involvement with the RUGS group.

I am a data scientist at Jumping Rivers, a data science consultancy. We collaborate with various companies on data-related projects, such as data storage, modeling, developing data visualization dashboards, and offering data science training. Initially, I had a background in Python, but I learned R while working at Jumping Rivers, where many of our staff are proficient in R, and much of our infrastructure is written in R.

At Jumping Rivers, we receive funding from the R Consortium. We organize the Leeds Data Science Meetups every two months and the North East Data Science Meetups every three months. Additionally, we hold annual conferences, such as Shiny in Production (October) and SatRdays London (April), which run once a year. I organize the North East and Leeds Data Science Meetups for Jumping Rivers.

Can you share what the local R Community is like? 

I am located in Newcastle, in the northeast of England, where a large community is keenly interested in data science. Our community includes Newcastle University and Northumbria University students, many of whom are studying data science or statistics. There are also professionals from various industries looking for data science jobs. Our meetups are attended by prospective data scientists and students eager to network and learn more about the field.

Both universities teach R, and many industries in the area employ data science techniques, including Northumbrian Water and Nissan. These companies use data science to solve everyday problems, such as detecting water leaks and optimizing manufacturing processes.

Data science is relevant across almost all industries, and R, along with Python and other languages, is a crucial tool in solving data science problems. In the Northeast, consultancies like Jumping Rivers specialize in data science. In summary, we have a large community of students and industry professionals in the Northeast, and it’s a similar story in Leeds.

You have a Meetup on “Improving the Fidelity and Stability of Large Language Models”, can you share more on the topic covered? Why this topic? 

During our Meetup on “Improving the Fidelity and Stability of Large Language Models,” we will explore how to enhance software solutions with AI capabilities, focusing on improving the accuracy and reliability of these models. Drawing from real-world experiences, we will discuss successful strategies for development, tackle the challenge of model ‘hallucinations,’ and address other significant obstacles. This topic is essential as the AI sector continues to grow rapidly, and integrating AI effectively is crucial for developers to achieve robust performance and innovative functionality in their projects. The session is designed for developers of all skill levels interested in incorporating AI into their work, ensuring they can implement practical and effective methodologies for positive outcomes.

Ryan Mangan will be presenting this meetup. Ryan is a seasoned technologist with over 18 years of experience in cloud computing, AI, and virtualization. He founded Efficient Ether Ltd, a Microsoft startup specializing in AI, cloud optimization, and sustainability. Ryan is a recognized Microsoft MVP, VMware vExpert, and Chartered Fellow of the British Computer Society. He has authored several e-books and publications, including “Mastering Azure Virtual Desktop,” and is active in public speaking and blogging within the tech community. 

Any techniques you recommend using for planning for or during the event? (Github, zoom, other) Can these techniques be used to make your group more inclusive to people that are unable to attend physical events in the future?  

Regarding techniques, I’m currently reviewing how we organize our meetups. Our meetups are free to attend for all participants, and we aim to create a welcoming and accessible environment for everyone to network and meet like-minded individuals in the area. The meetups are held every two to three months on weekdays in the evenings, providing attendees with time to travel from their place of work to the venue. We offer refreshments at the start, including pizza and soft drinks, and we ensure that vegan, gluten-free, and halal options are included to cater to a wide range of dietary preferences. 

We often run interactive workshops at the North East Data Science Meetups, including a recent meetup on the Apache Arrow interface for R, led by Nic Crane on July 18th. To make our workshops as inclusive as possible, we provide attendees with all necessary materials and dependencies via a cloud environment created using Posit Workbench. It allows participants without prior installation of RStudio IDE to contribute and interact with the workshop materials. Our goal is to make our workshops accessible to a broad audience, including those from non-R backgrounds. In general, we aim to create an event where attendees can participate without the burden of installing multiple packages or downloading data.

Most attendees attend our meetups to network and meet industry professionals, especially students exploring post-graduation career opportunities. With this in mind, we always reserve a part of the meetup for advertising similar meetups and conferences in the area and job opportunities in data science. Many attendees regard these meetups as a regular source of news, so we try to provide a central hub of information and a place to enjoy high-quality live talks and workshops.

These are in-person meetups. We could attract more people if we recorded and live-streamed it on Zoom. However, managing a Zoom call and recording would create more work for the organizers, and an in-person event provides better networking opportunities than online. In saying that, we will continue to look at ways to make these accessible and appeal to a wide range of backgrounds, and we will always take feedback from the community seriously.

What trends do you currently see in R language and your industry? Any trends you see developing in the near future?

In the northeast and Leeds data science meetups, there is a significant interest in machine learning, training and deploying machine learning models, and productionizing these models (ML Ops). Attendees often expect talks on these topics and are particularly interested in chatGPT, generative AI, and other related issues. However, data science encompasses a broader range of areas, including visualizing data and creating dashboards, and we try to cover all of these areas in our talks and workshops. Despite our efforts, there is a clear trend toward machine learning-focused discussions, with many talk submissions focusing on ML Ops and deploying models on the cloud.

How do I Join?

R Consortium’s R User Group and Small Conference Support Program (RUGS) provides grants to help R groups organize, share information, and support each other worldwide. We have given grants over the past four years, encompassing over 68,000 members in 33 countries. We would like to include you! Cash grants and meetup.com accounts are awarded based on the intended use of the funds and the amount of money available to distribute.

Kolkata R User Group: A Rich History with Statistics 

By Blog

The R Consortium recently spoke with Samrit Pramanik of the Kolkata R User Group about his experience starting a new R User Group in India. Samrit highlighted Kolkata’s rich history with statistics and talked about the diverse local R community.

The Kolkata R User group is organizing its second online event titled “A New Approach for Teaching Data Analytics with R” on July 13th. R users from around the world are invited to join this event.

Please share your background and involvement with the RUGS group.

My name is Samrit Pramanik. I work as a data scientist at a US-based private firm and have a post-graduate degree in statistics from the University of Calcutta. I have been using R since my post-graduate days in 2018 and used it extensively in various projects during my studies. Since 2022, I have also been an R instructor for a non-profit organization. Additionally, I have been involved in several short projects working with R. Since April 2024, I have managed the Kolkata R User group.

This is the third city-based R user group in India that is affiliated with the R Consortium. I plan to arrange virtual meetups monthly and in-person meetups annually. I enjoy helping and teaching people from diverse backgrounds, not only in statistics, mathematics, and data science but also in other areas. I want to teach them to use R language to add value to their professional and personal projects.

Can you share what the R community is like in Kolkata? 

The Kolkata User Group has been formed with a broader perspective that I would like to share with you. Kolkata is known for its reputation in statistical research and education. The city is recognized as the birthplace of modern statistics in India, with the establishment of the Indian Statistical Institute (ISI) in 1931 by a prominent figure in statistics. The University of Calcutta, where I graduated, was the first in Asia to offer a post-graduate degree in statistics in 1941. This rich history made the formation of the Kolkata R User Group inevitable. Our community consists of academics and professionals from diverse fields such as life sciences, healthcare, the public sector, physics, astrophysics, and other industries. This diverse background facilitates robust exchanges of ideas and techniques related to R and data, making our R community in Kolkata truly unique.

Please tell us about your recent and upcoming events?

I would like to highlight a recent event. Last month, in June, we had our inaugural session where we introduced Quarto, a recently released reporting tool by Posit. Our goal was to make the participants aware of this tool and its outstanding features, such as website building, ebook writing, creating thesis papers, manuscripts, and blogging sites. We aimed to show participants, including early graduate students, professionals in the industry, and researchers from academia, that they can use Quarto in their projects and studies for reporting. This was our first organized session.

The upcoming session is scheduled for July 13th. It will focus on a new approach to teaching R to students with non-technical backgrounds such as business students. Dr. Abhimanyu Gupta from Saint Louis University will be the speaker at this event.

We have received very positive feedback and responses from the participants who are showing interest in the upcoming events. They want us to organize such events frequently. People are very much aware of these events and this community. They are very responsive, and we have received positive responses. Two esteemed Economics professors have expressed interest in joining our organizing team and working with us.

Please share about a project you are currently working on or have worked on in the past using the R language. Goal/reason, result, anything interesting, especially related to the industry you work in?

Currently, I am working on two projects. The first project involves cricket analytics, where I extensively use R for cleaning up messy raw data and conducting exploratory data analysis at both the team and individual player levels and published a shiny dashboard on performance analysis of T20I players. I’m also building a statistical model to predict the total score of an innings, the winner of the match, and the tournament. Lastly, I aim to compile all the findings into an ebook format.

 Cricket Performance Analysis Shiny Dashboard

The second project revolves around converting the functions and features of AstroPy, an open source software package for astronomy and astrophysics, into R. Our goal is to enhance its popularity among researchers and scientists in the astronomy, astrophysics, and cosmology domains. I am collaborating with another individual from a physics background on this open source project, and we plan to publish it on GitHub soon for public access.

How do I Join?

R Consortium’s R User Group and Small Conference Support Program (RUGS) provides grants to help R groups organize, share information, and support each other worldwide. We have given grants over the past four years, encompassing over 68,000 members in 33 countries. We would like to include you! Cash grants and meetup.com accounts are awarded based on the intended use of the funds and the amount of money available to distribute.

Diving into R with Isabella Velasquez: Perspectives from R-Ladies Seattle

By Blog

Isabella Velasquez, co-organizer of R-Ladies Seattle, recently spoke with the R Consortium about her journey with R and the group’s recent activities. Isabella started as a beginner but has become a key figure in the R community thanks to the supportive and collaborative learning environment. R-Ladies Seattle regularly hosts in-person, hybrid, and online events, such as casual happy hours, lightning talks, and collaborations with other user groups. The group engages its members through creative activities and uses tools like GitHub for event planning. Their commitment to inclusivity and continuous learning helps maintain a dynamic and supportive community for R users in Seattle.

R-Ladies Seattle is seeking speakers for an upcoming lightning talks session. If you are interested in presenting, please contact Isabella.

Personal website | Twitter | Mastodon

Please share your background and involvement with the RUGS group.

I first encountered R when I started my graduate program in 2014. I was pursuing a Master’s in Analytics in Chicago. The program mainly revolved around using R. At that time, I was a complete beginner and had to start from the basics, like installing R. Since the program was fairly new, there wasn’t a well-structured curriculum for introducing R. It was assumed that students would either pick it up or already have some knowledge. The coursework focused on R from there.

My older brother Gustavo was a great resource when I started learning R and picking up the necessary skills. He is a highly proficient R user, so I asked him for help. He introduced me to many tools that made it much easier for a beginner to work in RStudio and pick up the tidyverse syntax. The main course curriculum was open to different approaches to using R, which provided flexibility in learning the tools and skills that interested me the most.

After completing my program in 2016, I landed my first job as a data analyst. I began using R and regularly working with data. Back then, Twitter was buzzing with activity. I stayed enthusiastic and continued learning from the community. My brother and I collaborated to solve problems and acquire new skills. At work, my team had diverse tool proficiency; some were adept in Excel, while others had data expertise. Eventually, we formed a learning community and collectively mastered R. We utilized R to generate presentations, reports, visualizations, and clean up data. It was fantastic to have a small community at work and a larger one outside through social media.

One of my colleagues, Chaya Jones, at my previous workplace, where I worked as a data analyst, was one of the original co-organizers for R-Ladies Seattle. The R user group had just started in 2018, and she invited me to join and give one of the earliest presentations for R-Ladies Seattle. Over time, the membership grew, and eventually, I became one of the co-organizers. My role involved coordinating events, finding speakers, and other related tasks.

I am very fortunate because I got into R in a friendly and collaborative environment. During graduate school, I collaborated with classmates and gained valuable knowledge from my brother. Later, I landed a new data analyst job and had a whole team of people who were interested in learning and using R. It has truly been a joy, and I feel appreciative for how well things have worked out and for the length of time that I’ve been able to use R.

Can you share what the R community is like in Seattle?

As I mentioned, my workplace involved various programming languages, but there were quite a few R users. We used to have these small study groups where we discussed creating an R Markdown template for our company and shared Shiny apps and other similar things. The field I worked in was education, but in Seattle, you see a lot of R being used in bioinformatics and scientific research related to diseases. It’s very popular among those groups, and they have solid user groups where they grow and learn together. Many members of R Ladies Seattle are from organizations like Fred Hutch, where the emphasis on using R is very strong, which is pretty great.

Every month, R-Ladies Seattle hosts a casual happy hour. We have good chips and salsa, and it’s a great opportunity for members to join, chat, and have a good time. Additionally, after the Cascadia R Conference in June, we will have a social hour where people can keep the conversation going in a relaxed setting. We will also host a social hour at the end of posit::conf in August, and R-Ladies who didn’t attend the conference are more than welcome to join and hang out. We organize many social events, so there are plenty of opportunities to connect with us.

We have some exciting events related to R coming up. We are currently looking for speakers for a lightning talk session, where individuals can quickly share the projects they are working on or a tool they love. It’s a low-pressure way to join in, and we welcome anyone who would like to sign up and participate.

Our focus is primarily on in-person and hybrid events. While we have seen an explosion of online events after COVID-19, it’s important to uphold the Seattle community by providing opportunities for local participation. Generally, our events are held in person, with occasional hybrid events. However, we are also excited about organizing online events with Seattle residents in mind at a convenient time for the Pacific Time Zone. Our offering of in-person, hybrid, and online events provides a unique experience for our user group in Seattle.

Any techniques you recommend using for planning for or during the event? (Github, zoom, other) Can these techniques be used to make your group more inclusive to people who are unable to attend physical events in the future? 

One thing we implemented was to think of events that could generate high engagement. For example, with our Hex sticker, we organized a competition for all R-Ladies members to participate by submitting their designs, followed by a voting process. It was a lot of fun, both creatively and in terms of getting everyone involved. We strive to come up with similar engaging activities. Additionally, when appropriate, we reach out to other user groups in the area to explore collaboration opportunities, co-hosting events, or simply support each other’s promotions to foster a strong sense of community.

One method we have tried for planning events is using GitHub discussions to log our ideas for events and determine which events are the most popular based on comments and upvotes. This helps guide our future event planning.

What trends do you currently see in R language and your industry? Any trends you see developing shortly?

Every year, we send out a survey to inquire about people’s interests and what they like to see. The responses are usually a mix of technical content, with many requests for intermediate-level information. There’s a lot of interest from people in Seattle who use R in some capacity or are members of R-Ladies Seattle. They are looking for opportunities to upskill based on their existing knowledge of R. Additionally, there are many requests for information about career advancement and available positions.

There are various job titles related to data, such as data scientist and data engineer. Many people have questions about the career prospects in this field, including the potential for advancement and available options. These are common topics of discussion.

Please share about a project you are currently working on or have worked on in the past using the R language. Goal/reason, result, anything interesting, especially related to the industry you work in? 

I now work at Posit,  formerly RStudio, in a marketing role. I still get to work with R a lot, which is great for creating dashboards to track various metrics. I’ve been focusing on defining metrics of success and similar tasks.

Recently, I created a dashboard in Shiny that refreshes daily to compile the information I need for my to-do list. Every morning, I check my Shiny dashboard to see my daily tasks. It pulls information from my project management tool, so I only have to update one place to see an aggregated view of my month. It was fun to do this in R with Shiny. 

Recently, I worked on creating a custom template in Quarto for the upcoming R Medicine Conference website. The website is built entirely on Quarto, a new tool similar to R Markdown. My work specifically involved designing the events page to display previous events and provide links to the event page and YouTube playlist. It’s exciting to learn and work with new tools like Quarto.

How do I Join?

R Consortium’s R User Group and Small Conference Support Program (RUGS) provides grants to help R groups organize, share information, and support each other worldwide. We have given grants over the past four years, encompassing over 68,000 members in 33 countries. We would like to include you! Cash grants and meetup.com accounts are awarded based on the intended use of the funds and the amount of money available to distribute.

R Consortium’s Submission Working Group: Advancing R for Regulatory Success at PharmaSUG 2024

By Blog

The R Submission Working Group is making significant strides in promoting the use of R for regulatory submissions in the pharmaceutical industry. At PharmaSUG 2024, held from May 19-22 in Baltimore, MD, the group’s impact was evident through various insightful presentations and discussions.

One highlight was Ben Straub’s presentation, “Piloting into the Future: Publicly available R-based Submissions to the FDA,” which showcased the growing adoption of R in both industry and regulatory settings. Straub emphasized the vibrant R community and its diverse packages that enhance statistical analysis and data visualization, highlighting R’s role in facilitating efficient and transparent FDA submissions.

Additionally, André Veríssimo and Ismael Rodriguez’s presentation, “Automating SDTM Using R: A Practical Guide,” demonstrated the advantages of using R for automating the creation of Study Data Tabulation Model (SDTM) datasets. They provided a detailed guide on implementing automation techniques and sharing best practices and real-world applications to improve data management workflows with R.

These presentations underscored the R Submission Working Group’s contributions to advancing the use of R in regulatory processes promoting greater efficiency, reproducibility, and transparency in pharmaceutical data management.

R Addicts Paris: Promoting Diversity in R

By Blog

Vincent Guyader, organizer of the R Addicts Paris and president of ThinkR, recently updated the R Consortium on the group’s activities. Last year, Vincent discussed the application of R in developing solutions for industrial problems. He emphasized the importance of helping people become fluent in R and leveraging the language to add value to their work. ThinkR is dedicated to enhancing R proficiency in various industries. The R Addicts Paris, one of France’s oldest and largest R user groups with 1,800 members, continues to foster a strong R community under Vincent’s leadership. 

Please share your background and involvement with the RUGS group.

My name is Vincent, and I have been using R since my student days. During my studies, I took on freelance R projects for various companies. Currently, I head a company called ThinkR, where we have a team of over 10 experts specializing in everything related to R. Our services include training, consulting, developing Shiny applications, creating R packages, and more. We also collaborate with Posit and handle hardware installations for clients, primarily in France but also in Switzerland, Belgium, and other parts of Europe.

Since 2018, I have been managing the R user group in Paris, known as the R Addicts Paris. It’s one of the oldest and possibly the largest R user groups, with 1,800 members. I aimed to organize meetups every three months, but the next one has been delayed due to internal organizational issues. I genuinely enjoy helping people become fluent in R and use the language to add value to their work.

What challenges do you face in organizing the R Addict Paris group and how do you overcome those challenges?

One of the main challenges is that our users are not professional programmers or developers; they are specialists in fields like biology and finance. They have to shift their mindset to use programming languages. My daily job involves helping these individuals embrace software development. Coming from a genetics and biochemistry background, I understand how challenging this can be for non-developers. However, I love doing this, and I have a dedicated, competent team to assist.

Based on your work with ThinkR, which industries in France do you see using R?

We have clients in various fields across France, including finance, retail, and research. The health sector is particularly prominent. For instance, a company that used SAS a few years ago now uses R & Python. About half of our clients currently use Python. While we provide Python installation on hardware, we don’t offer Python training yet.

We are committed to being the sole organization in France that can certify R users and developers. The French government has authorized us to issue an official certification akin to a diploma. Our goal is to elevate R proficiency across various fields in France. Our clients include businesses and individuals, with many investing their resources to learn proper software and programming skills.

Do you host online or in-person events?

I chose not to host online events. It’s a very opinionated choice because most meetups switched to online formats during the pandemic. At ThinkR, we are a fully remote company, and I spend my day on Zoom. While remote training is effective, I’ve found that in-person events work better for our user group.

Any techniques you recommend using for planning for or during the event? (Github, zoom, other) Can these techniques be used to make your group more inclusive to people who are unable to attend physical events in the future?   

One of the main challenges we face as a group is finding female speakers. I try to avoid having only male speakers, but I only get female speakers every fifth or sixth event, which is not enough. I encourage other R user group organizers to recognize our power to give a voice to different kinds of people. I push myself to include more female speakers. Sometimes, I encounter highly qualified women who hesitate to speak, while less experienced men are more willing. It’s challenging, but I strive to maintain a balanced representation.

I consciously avoid engaging with speakers who lack substance, ensuring I have time to encourage qualified women to share their knowledge. Despite my efforts, female representation remains below 20%. A few years ago, my colleague Diane and I tried to connect with the R-Ladies Paris group. Many men are actively engaged there, and I wonder why that is.

There are many skilled women in the R community, which includes biologists and geneticists. There’s no excuse for the lack of female representation. We must remember our influence and endorse individuals who truly represent our values.

What are some trending topics in R in your R User Group?

I’ve noticed a decline in interest in statistics over the past two to five years. During meetups, we rarely discuss statistics. The machine learning and AI fields aren’t well-represented in R, possibly because most people in these fields use Python. It could also be due to regional differences or my network.

You had a Meetup “Raddicts x RTE – {webr} – Shinyproxy and return of the Reconteres 2024” on 19th June, can you share more on the topic covered? Why this topic?

For this event, we had two male speakers. Colin Fay discussed {webr}, a new JavaScript capability for launching user insights in the browser. This is powerful for deploying Shiny applications. Valentin Cadoret talked about new Shinyproxy functionalities, and tools that enhance the deployment of Shiny applications. So we focused heavily on Shiny once again.

How do I Join?

R Consortium’s R User Group and Small Conference Support Program (RUGS) provides grants to help R groups organize, share information, and support each other worldwide. We have given grants over the past four years, encompassing over 68,000 members in 33 countries. We would like to include you! Cash grants and meetup.com accounts are awarded based on the intended use of the funds and the amount of money available to distribute.

The Crucial Role of Release Control in R for Healthcare Organizations

By Blog

Guest blog contributed by Ning Leng, People and Product Leader, Roche-Genentech. Eric Nantz, Director, Eli Lilly and Company; Ben Straub, Principal Programmer, GSK; Sam Parmar, Statistical Data Scientist, Pfizer. 

Supporting the science of drug development requires computational tools with careful implementations of core statistical functions and data structures. The R programming language, a general purpose language developed by statisticians that grows dynamically through the contributions of a worldwide community of developers is a common choice for serious statistical work. However, managing new versions of the core R language and the hundreds of specialized libraries (called packages in R) necessary to support multiple development groups in a way that ensures the consistency, reproducibility, and reliability of results poses many practical challenges 

The FDA, for example, requires that the software and tools supporting a clinical trial submission are capable of producing reproducible results for an extended period of time. This means submitting code based on a version of R that is sufficiently tested and stable yet new enough to support the critical R packages over the required FDA time horizon.

So, how is the R environment release managed across different healthcare organizations?  We interviewed individuals from different pharma companies to learn their internal approaches to keep their R environment up-to-date and secure.

  • Roche’s Scientific Computing Environment is container based, with clinical reporting done from managed qualified images being released twice per year – roughly timed to capture the last update to an R major version (April release) and a 6 month later update (September release). For each image, R packages undergo a mostly automated risk assessment to document package quality. Automated indicators of package quality include test coverage, thoroughness of documentation, test coverage of exported objects (using covtracer), and may be supplemented with package adoption measured using download counts, author reputation or other peripheral knowledge of the package’s history. Prior to internal publication, a representative sample of reverse dependencies are re-evaluated to safeguard against breaking changes. If the package meets our quality criteria it is published to a continuously updated repository of validated packages corresponding to the image’s R minor version (e.g. x.x). This allows flexibility for teams to roll forward to newer releases of packages within a managed release by moving their renv snapshot to a later date, easing the transition between bi-annual image releases. A generalized version of Roche’s automated process has been open sourced as ‘theValidator‘, and more details on the Roche process was shared within the R Validation case studies series.
  • Eli Lilly currently updates its qualified R environment only after a new major release of R is available and the corresponding release of Bioconductor (utilizing that version of R) is also available. In a new release, all packages currently installed from the CRAN and Bioconductor repositories are refreshed to their latest versions at the time of the release. Once the new R version is deployed, all packages are frozen for that particular release to ensure stability and reproducibility. Lilly maintains multiple R versions for backward compatibility. Only packages available on CRAN or Bioconductor are permitted for installation in the central package library. Lilly uses a hybrid approach of automation and risk-based assessment when a new package is requested for installation. In the event that a new version of a package is necessary for a project (such as a new Shiny application), the users are encouraged to leverage the renv package created by Posit to create a project-based environment which will not impact the central package library. As technology evolves and the R language becomes more prominent in clinical data analysis, Lilly continues to assess the current and future possibilities of a robust clinical computing environment primed for innovation while adhering to the foundational principles of reproducibility and transparency.
  • GSK releases “frozen R environments” for clinical reporting work on a 6-12 month cycle.  The choice of R version is the latest stable release with at least one patch release of R, e.g. 4.3.1 rather than 4.3.0.  As R itself is stable with decades of use, we prefer to focus on package assessment for building of our “frozen R environments.”  Packages for this environment can be from external sources (CRAN, Bioconductor) or internally built at GSK, regardless of origin we assess the same way.  We pay close attention to author qualification and institutional backing, types and breadth of testing, documentation and examples, and the practice of software development life cycle practices.  Once a package is approved in this process it will be included in the frozen environment.  Packages change over time, if substantial changes are implemented in the packages, then we re-assess with a focus on those changes for allowing up-versioning of the package in the frozen environment.  These frozen environments ensure that clinical reporting can be easily reproduced if needed as all packages versions and the version of R used during the analysis are contained in the frozen environment.  
  • Pfizer releases one new R version every year. We typically target R-x.y.1 releases to pick up patches – so we might consider this a “stable” release. The process of testing, documenting, and deploying R into validated containers is performed every 6 months, with a new release of R once per year, e.g. R-4.3.1, and an update to package set and package versions 6 months later (for the same R version). We take a snapshot date of CRAN to form the basis of our package set for the container build. We try to balance competing priorities of getting latest versions of packages and newest package releases, while maintaining a snapshot and version-controlled release to ensure reproducibility and stability.

Here is what we have: four companies and four somewhat complex bespoke solutions. It seems likely that if we interviewed a hundred representatives from a hundred different companies we would get at least a hundred different solutions. It is also not difficult to imagine that multiple protocols for managing R and package versions imposed a fairly complex project management solution on the FDA as it simultaneously deals with submissions from multiple sponsors.

In the R Consortium’s R Submissions Work Group meeting we have been discussing whether there might be a simple solution for at least dealing with the R versioning problem that might serve as a de facto standard for the industry. One suggestion that has gained some traction is that sponsors use the previous minor and latest patched R version for a submission. For example, if R version 4.4.0 is currently available then it is suggested that a sponsor uses the latest patch version (4.3.z). If R version 4.5.0 becomes available, then it is suggested that a sponsor uses the latest patch version (4.4.z). This ensures that the minor version is stable and most likely available to all stakeholders. Of course, if a version change eliminates a security problem, that might be preferred. (Note that R versions are organized as R x.y.z where, x is the major version, y is the minor version, and z is the patch version.)

We would love to hear what you think. Please, go to Issue number 117 on the GitHub repository of our working group and leave a comment.

Bridging the Digital Divide: Umar Isah Adam on Expanding R Access for Kano, Nigeria Students

By Blog

Umar Isah Adam, the founder and organizer of the R User Group Kano, Nigeria, spoke with the R Consortium during the pandemic about his efforts to engage the next generation of students in the R community. Recently, the R Consortium followed up with Umar to discuss the group’s progress over the past few years. He discussed the increasing acceptance and interest in R within academia. The user group is working with various colleges in Kano state to introduce R to students and teach them the fundamentals. Umar also shared his experience using R for managerial tasks related to student data. He hopes to persuade college management to use R for data handling instead of the current manual processes.

Please share your background and involvement with the RUGS group.

My name is Umar Isah Adam, and I’m from Kano State, Nigeria. I studied mathematics at the Federal University Dutse, Jigawa State. During my studies, I became interested in statistics and technology. One of my lecturers mentioned R as a statistical analysis tool, which piqued my interest. I learned it by researching online and watching videos. Later, a friend introduced me to R User Groups. I found that I was interested in R and noticed there wasn’t a group in Kano State, so I applied to start a chapter there, and it was approved.

Can you share what the R community is like in Kano, Nigeria? 

The use of R is relatively new in Kano State. Most academics in the area use SPSS in their work. It makes it challenging for R to gain traction in this environment. Despite the challenges, we have been making progress with the support of our user group. Currently, I work as an assistant lecturer at a college in Kano State. I recently organized a well-attended seminar for lecturers and students at the Kano State College of Education and Preliminary Studies. I also posted a video of the workshop on YouTube and have received requests for more information.

There’s room for improvement. We’ve received requests from academic institutions to host events or provide information about the power of R. However, we cannot do so now due to the nature of my work and inadequate funding. However, we plan to start a 10-week training session soon. It will likely be free, as we are collaborating with the Kano State College of Education and Preliminary Studies to organize it. R isn’t very popular here, and more than 70% of academicians need help understanding what it is and how to use it effectively. However, those introduced to it have shown a high interest in learning and utilizing it.

We aim to introduce R to the academic community, and after this, we plan to move on to another college and launch a new program. In summary, R is not widely known in our society, but we are progressing. There has been an increase in the acceptance of R and a growing interest from different people in academia, particularly in R. Many are interested. Still, there needs to be more awareness about it. Most people need to learn what R is and how to use it. Therefore, most of our upcoming programs will focus on introducing the R language.

Additionally, there is an issue with student access. Most of our students don’t have personal computers and can only access them on campus, usually at the ICT department. This lack of access also affects student engagement. However, among academics and lecturers in our colleges, there is growing interest in R.

Do you host in-person or online events? How do you make your events inclusive? 

It’s important to remember that online events became essential during the pandemic. However, due to internet connectivity issues, we avoid online meetings or events most of the time. As a result, our sessions are usually held offline. We have been hosting events within colleges and other institutions to make them easily accessible to students and academics. It is also more cost-effective and popular than hosting in private locations. Advertising these events has proven effective, as interested individuals are usually willing to attend when they see the advertisement. 

We attempted to transfer between colleges, such as those owned by the state government. The majority of the data and processes are research-based. Therefore, we strive to incorporate more R programming aligned with academic requirements. We aim to limit topics to the use of R in academia to ensure that attendees feel more connected and can see the practical applications of using R. For instance, compared to using SPSS, where one often needs to use code or convert data into another format, with R, one can easily import data into the working environment and manipulate it as needed.

Please share about a project you are currently working on or have worked on using the R language. What is the goal/reason, result, or anything interesting, especially related to your industry?

I usually demonstrate to people around me, including the school management, how easy it is to use R. For example, we need help with the examination office potentially losing some of their data. However, they have a backup on an external drive. I am importing the data from the old template to the new one in Excel format. I am also working on calculating the student results and offloading them into the new portal we have developed. Doing this job manually might take a month, but if I successfully create this program, it will complete the job in two to three days. It will demonstrate to the school management the importance and impact of using R.

I am proposing to the college management to introduce a certified course of study on “Introduction to R” within the ICT department. Showcasing how this programming language can impact the working environment will help them understand the need for this course. Many students rely on fundamental analyses using questionnaires, frequency, and percentage without exploring visualization techniques. As a supervisor, I encourage using R for data analysis in student projects, as it provides a more comprehensive approach. However, many students need access to computers. Therefore, by offering this course, we can equip them with valuable skills and knowledge to benefit their future careers.

How do I Join?

R Consortium’s R User Group and Small Conference Support Program (RUGS) provides grants to help R groups organize, share information, and support each other worldwide. We have given grants over the past four years, encompassing over 68,000 members in 33 countries. We would like to include you! Cash grants and meetup.com accounts are awarded based on the intended use of the funds and the amount of money available to distribute.

Keith Karani Wachira: Leading the Dekut R Community in Kenya and Innovating with R 

By Blog
presenting at build with AI how to us Gemini API in shiny and R

Keith Karani Wachira, the Dekut R Community organizer based in Nyeri, Kenya, was recently interviewed by the R Consortium and shared his journey in the R community, which began in 2019 during his university years. Sparked by a tech meetup, Keith’s interest grew through the pandemic sessions. Now in academia, he uses R to address business automation challenges, attracting industry professionals to his practical sessions. Excited by trends like AI integration and tools like Quarto, Keith foresees increased automation and efficiency. Outside work, he enjoys baseball, graphic design, web development, and teaching R, finding great reward in his students’ success.

Please share about your background and your involvement in the R Community. What is your level of experience with the R language? 

I began my journey with R in early 2019 while studying at university. In May 2019, I learned about a tech community through a friend who posted in one of our school’s WhatsApp groups, inviting us to join a meetup. Curious, I decided to attend.

I remember the meetup was on a Saturday, and it turned out to be the launch of a new club. My friend invited me and was part of the Microsoft Learn Students’ Ambassadors. His classmates used R for their engineering projects, which sparked my interest.

During the first lesson, I found it challenging as there were about 30 students, most of whom were first-year students pursuing various degrees, including Business Information Technology, which I was majoring in, along with a minor in Communication. My first programming language that year was C, which I found interesting.

Over time, I found the R language interesting, especially its syntax. What fascinated me the most was how data could be used to create visualizations. This curiosity led me to explore data from my local sewerage and water company, using R to create informative visualizations and derive insights that can be used in decision making.

I continued attending the sessions in 2020 during the pandemic. Although we no longer had in-person classes, we adapted using Microsoft Teams for our meetings. Eric organized the meetups and arranged tech talks with speakers from Posit (formerly RStudio) and NairobiR. I remember attending these sessions and understanding how powerful R is.

Throughout 2020, I attended regularly but still lacked confidence in the language. However, in 2022, I made significant progress. Under Eric’s leadership, we expanded the community to involve more people, especially students from the department of Actuarial Science, Telecommunication Engineering and electrical engineering. We set up a structured learning environment based on materials from Hadley Wickham’s books and resources from the R website and blogs.

Eric’s leadership greatly influenced me. He taught us how to write blogs using Markdown and publish on RPubs. This is a bit about my background. Today, we continue to teach R, following a structured approach to help others intermediate in using the language.

What industry are you currently in? How do you use R in your work?

I’m currently in academia, primarily focusing on various technical challenges. We hold sessions where we demonstrate the use of R in robotics for members in Electrical Engineering and Telecommunication Engineering. For those in Actuarial Science, we show how to create time series models using R.

Coming from a background in business and information technology, I focus on solving business challenges, particularly automating business processes and addressing issues in banking, logistics, retail using opensource datasets. Our efforts are not limited to academia; we concentrate on applying R across different disciplines within academia to tackle these challenges.

Why do industry professionals come to your user group? What is the benefit of attending?

An interesting scenario arose when I became interested in EMS (Engineering and Management Systems). We started organizing hybrid sessions after the COVID period and it caught interest of students from another university in Kenya ,Egerton University. Through, statistical analysis bureau of Egerton University they joined our sessions to learn how to leverage tidy models packages to create machine learning models and also collaborate with the community members.

They were very interested, and as future economists, we demonstrated how to build and appreciate these models. In previous meetups, we also introduced participants to Shiny apps, teaching them how to host their models and create interfaces to display their work.

Another valuable skill we taught was generating reports using R Markdown. This allows users to write code, format text, add videos, images, and emojis, and present their work in a professional and engaging manner. Attendees found this particularly useful as it enhanced their ability to write, structure, and report code effectively.

Participants learned to leverage the R ecosystem for coding, structuring their work, and reporting their findings by attending our sessions.

awarding participants with our community swag during build with AI event in collaboration with Google students developer group April 2024

What trends do you currently see in R language and your industry? Any trends you see developing in the near future?

A trend I’ve noticed is the widespread effort to include everyone in learning programming languages like R. This is evident in the emergence of specialized groups such as R for Medicine and R for Pharma. Two of our alumni even demonstrated how R can be used in robotics through a talk at Posit Conference 2022, demonstrating its applicability in specific industries. This specialization fascinates me, and I am eager to see how R will be used across various fields.

Another trend is using tools like Quarto, which facilitates the implementation of such specializations. Additionally, I am excited about the incorporation of AI in building R applications, such as using Gemini for Shiny apps. Although materials on this are currently limited, I see this as a growing trend.

The integration of AI will likely lead to the automation of many manual processes, further enhancing R’s utility and efficiency in various industries.

We would like to get to know you more personally. Can you please tell me about yourself? For example, your hobbies/interests or anything else you want to share.

participating & winning the data science & AI hackathon in 2022

When not in front of my laptop, I enjoy playing baseball and softball, especially as a catcher. Catching allows me to see the entire game command the play, and I enjoy throwing the ball from home to second base and picking off a runner. It’s a challenging position that helps me focus and improve my aim.

On the side, I also do some graphic design using Canva which I use to create posters and newsletters for our community meetups. Additionally, I have web development skills using MERN stack.

Another passion of mine is teaching R to others. I love seeing people learn and apply the concepts and then go on to teach others. One of my students from his first year has now taken over as a lead in our community, which is incredibly encouraging. He even competed in hackathons and finished fourth, showing how much he has grown.

Teaching and seeing others succeed is something I find very rewarding and motivating.

How do I Join?

R Consortium’s R User Group and Small Conference Support Program (RUGS) provides grants to help R groups organize, share information, and support each other worldwide. We have given grants over the past four years, encompassing over 68,000 members in 33 countries. We would like to include you! Cash grants and meetup.com accounts are awarded based on the intended use of the funds and the amount of money available to distribute.

Full-time Korea R User Group Founder Victor Lee Sees AI Future for R and Quarto Textbooks

By Blog

The R Consortium recently interviewed Victor Lee, organizer of the Korea R User Group, about his role establishing and expanding the Korean R community. Victor shared his journey, beginning with an introduction to R and open source programming languages while working at the Hyundai Motor Company, and later, his efforts in establishing the tidyverse community in Korea. He highlighted his extensive experience with R, including writing blog posts, publishing Quarto books, and building websites for the Korea R User Group. Victor will be a Software Carpentry instructor at the Software Carpentry Workshops at Sejong University. 

Please share about your background and your involvement in the R Community.


My first introduction to our community was about 10 years ago, and it wasn’t a good experience. I used to work at the Hyundai Motor Company at that time and was intrigued by the software carpentry led by Greg Wilson. I also delved into statistics and open-source programming languages, particularly S and R programming. I was heavily involved in posting about tidyverse, which was my entry point into the community environment. In Korea, I sought out the Korean community, which mainly focused on the basics. This made me realize the need for a community in Korea based on tidyverse principles, and that’s why I started the tidyverse community in Korea 10 years ago.

I was first introduced to S-PLUS during my undergraduate years as a statistics major, and I was fascinated by its superior graphics compared to SAS/SPSS. After majoring in computer engineering and working at Hyundai Motor Company for 10 years, I obtained a Software Carpentry Instructor certification and translated “Python for Informatics” into a Korean book. I became captivated by the Hadleyverse, and Since 2016, I have been co-organizing the Seoul R Meetup, sponsored by Kyobo DPLANEX (a continuous sponsor and is currently the largest sponsor of the Seoul R Meetup, representing one of South Korea’s leading insurance companies) alongside Choonghyun Ryu, the founder of the Korea R User Group. In 2021, we hosted the Korea R Conference, and in 2021, we established the Korea R User Group as a non-profit organization, transitioning from a community to an official organization.

What is your level of experience with the R language?

With the support of the R community, ChatGPT, and Copilot AI, I now confidently tackle any data science problem using R. For about 10 years, I’ve consistently written blog posts using R Markdown and now Quarto. Upgrading my e-books with Bookdown led to the publication of five Quarto books on data science. Using the Quarto framework, I also built the Korea R User Group and R Conference websites. As a civic data journalist, I’ve written around 100 articles utilizing R’s visualization capabilities. Reflecting on my journey, I see how effectively I’ve applied the R language in various fields.

What industry are you currently in? How do you use R in your work?

I originally set up the Korean R community 10 years ago and am a founding member of the nonprofit Korea R User Group, established three years ago. I left KPMG to dedicate my time to running the Korea R User Group. This year, I have been fully involved in managing the organization and leading several projects, including two major abandoned projects, focusing on them for the past few months.

Currently, I am focusing on publishing and developing open statistical packages at a non-profit public interest corporation. In 2020, with good intentions, I started the “Open Statistical Package” project to independently develop statistical packages like SAS, SPSS, and Minitab. However, some Shiny developers without a strong background in statistics took the project in their direction, causing it to lose steam. It felt as though they had hijacked the project and the hard work the Korea R User Group put in, leaving us frustrated and disappointed. 

To prevent this kind of thing from happening again, we’re beefing up our license policy, including trademark registration for BitStat[1]. We’re also switching up our development engines to webr and shinylive and are in the process of creating BitStat2[2].

[1]: https://github.com/bit2r/BitStat

[2]: https://github.com/bit2r/BitStat2

We also established a publishing company named “BitStat” as the Korea R User Group promoted Quarto digital writing as a new open source project. Recently, we have published and released five data science books, expanding the base of R users. While writing the sixth book on probability and statistics, I restarted the development of open statistical packages using Web-R and Shinylive.

R has evolved from a simple data analysis and statistical language to a tool that can replace office software. I now use Quarto to create almost all documents, and R is the first language I use in developing the open statistical package that I am currently working on.

Why do industry professionals come to your user group? What is the benefit for attending?

In Korea, about 20 to 30 years ago, R was the number one programming language for data science and statistics, particularly in areas like machine learning. However, with the rise of Python, many R users transitioned to Python due to its increasing popularity. Despite this shift, R remains significant in Korea, with many people continuing to use both R and Python.

For my day-to-day work, I find R quite convenient and easy to use, especially for therapeutic data and open-source case studies. This year, I’ve noticed that users who join the Korea R User Group come from diverse backgrounds, including drug discovery, regulatory agency, and real estate.

Over the past decade, many users joined the group to determine whether Python or R was better suited for their work. However, the recent trend clearly leans towards artificial intelligence development, such as LLM (Large Language Model) development. Participants from various industries with an interest in quantitative analysis are now attending the user group.

Their motivation for attending, apart from AI fields represented by LLM, is to acquire the latest technology in other data science areas and to gain knowledge from diverse, in-depth analysis experiences and model development. Additionally, many people come to obtain information about Quarto, ggplot, gt, and shiny, seeking business opportunities related to these tools.

What trends do you currently see in R language and your industry? Any trends you see developing in the near future?

This year, our community in Korea is focusing on Quarto due to upcoming government policy changes. Analog methods are expected to disappear within five years, so the government is funding the development of AI digital textbooks. I believe Quarto technology, the next generation of R Markdown, is perfect for this purpose.

As generative artificial intelligence (AI) has gained significant attention in Korea, there is growing interest in using R and Python together with generative AI to solve data science problems and increase productivity, rather than focusing on the languages themselves. When using generative AI with languages such as R, Python, and SQL, it becomes necessary to find tools that can automate and store the outputs, inevitably leading to increased interest in Quarto.

This perspective has been reinforced by my experience using Quarto in various ways, starting from R Markdown. I have come to realize that Quarto is truly well-suited for generative AI and data science. If other countries are developing AI texts using Quarto or R Markdown, we could introduce this technology to the Korean market and the Korean government. 

Having written five books – plus a sixth on probability and statistics – I’ve experimented with various features of Quarto books. I’ve realized we no longer need older statistical packages like SAS and SPSS. My current project involves implementing statistical software using WebAssembly (WASM) technology.

We would like to get to know you more personally. Can you please tell me about yourself? For example, your hobbies/interests or anything else you want to share.

Initially, I wasn’t sure if I would succeed, but I became involved in election campaigns and grew passionate about analyzing political and election data. My interest lies in using data to uncover trends and insights from various social datasets.

Next month, we will have a data journalism meetup, and I have friends who will join because of the articles I wrote. They will showcase some of their analyses on TV, including summaries of data related to election campaigns.

I first developed a connection with data while majoring in statistics and then pursued computer engineering in graduate school. Although this combination of backgrounds is common now, it was unusual in Korea at the time, giving me a unique career path. My passion for open-source software and faith in the community have driven me to where I am today.

I enjoy analyzing data, and whenever I come across interesting datasets, I analyze them and document my experiences on my blog. This hobby, along with the copyright-free nature of data, led me to develop an interest in predicting election winners using data from annual elections in South Korea. Since 2016, I have experienced three general elections, presidential elections, and local elections. Although there won’t be an election next year, I am very much looking forward to the next one.

How do I Join?

R Consortium’s R User Group and Small Conference Support Program (RUGS) provides grants to help R groups organize, share information, and support each other worldwide. We have given grants over the past four years, encompassing over 68,000 members in 33 countries. We would like to include you! Cash grants and meetup.com accounts are awarded based on the intended use of the funds and the amount of money available to distribute.