By Amanda Hart, Co-organizer of South Coast MA UseR Group
2020 was a year of firsts: first global pandemic in my lifetime, first year working remotely, first year not traveling home for the holidays, and on a more positive note the first year for the South Coast MA UseR Group. Just before lockdown I had the opportunity to join an Openscapes workshop led by Julia Stewart Lowndes. I spent the week thinking about open data science and learning about tools to aid in collaboration, but I never expected to need to exercise those tools so quickly or extensively. Overnight my community changed. Offices closed, schools closed, classes turned into remote learning experiments, and my community of students and coworkers scattered. This is when the South Coast MA UseR Group was born.
Our R user group started as an excuse to stay in touch and build on the small community formed by the Openscapes workshop. I found a wonderful co-organizer, Amanda Meli, and together we started our monthly meetings. We invited anyone remotely interested in R to join our fledgling group and take the opportunity to “see” people again. Over the course of this last year, our local R user community in southern Massachusetts, USA, expanded to include students and professionals from across Massachusetts, the U.S. and the world with several guest speakers calling in from abroad (one of the benefits of remote meetings).
In so many ways 2020 was a hot mess, but our monthly UseR meetings have been a welcome source of consistency, community, and learning throughout. We are continuing our remote meetings as we start year two, but with any luck (and a dash of science) I look forward to meeting some of my newfound community members in person in the coming months. But until that hope is realized I cannot thank enough my co-organizer, group members, guest speakers, and behind the scenes supporters for making this crazy year better.
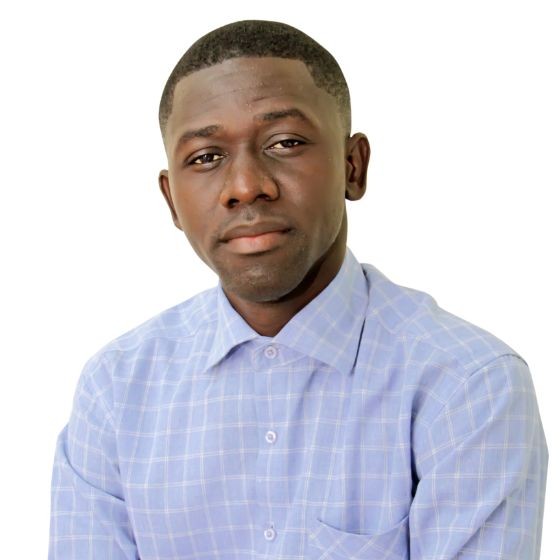
It can be difficult running an R user group in a country where R does not have a large following. R Consortium talked with Francis Mensah, who runs the R Users group in Accra, the capital of Ghana. Francis discussed how they went virtual during the pandemic, and how they are working on ways to help grow R users in Ghana.
Francis is a Statistical Consultant, Data Quality Scientist, Chief Operations Manager, M$E Fellow, Programmer, Data Analyst, and Principal R Organizer and co-founder for the Accra R Users Group. He is also a Business Development Consultant for Kims International. Kims International provides M&E, Research and Capacity Building in education, public health, gender, water and sanitation and livelihood for governmental and non-governmental institutions.
RC: What is the R community like in Accra?
FM: The R community in Accra is relatively new. Most people here are not aware of it. Most people here use Stata or SPSS, as they are taught in schools here. Awareness in Ghana is relatively low for R. We are trying to create awareness of R through our group.
RC: How has COVID affected your ability to connect with members?
FM: Because of restrictions imposed, we have not been able to meet face to face. Because of this, we meet online. We were planning our first meeting when COVID came. We meet almost every weekend virtually. We get people from not just Accra, but a lot of international people as well.
RC: In the past year, did you have to change your techniques to connect and collaborate with members? For example, did you use GitHub, video conferencing, online discussion groups more? Can these techniques be used to make your group more inclusive to people that are unable to attend physical events in the future?
FM: For our meetings, we use zoom, goto meeting, and WhatsApp to meet virtually. These work best for us. We will also try to have a Ghana R conference with other groups as well. We will use the same apps for our meeting for the country-wide one.
RC: Can you tell us about one recent presentation or speaker that was especially interesting and what was the topic and why was it so interesting?
FM: What Every Data Scientist Must Know About Teaching and Learning by Greg Wilson. Everyone was happy and excited after the presentation. It opened our eyes. When going through the technology we use, it can be difficult to see. He used images to go through the talk. They were highly effective. It was so well received that members asked when the speaker was coming through again. It was very exciting and it opened our eyes to teaching and learning for all of our members, including me.
Another good one was given by Dr. Riinu about ggplot that we were excited about because it was about graphics. The part that we liked was that she gave out exercises to try during the presentation.
RC: What trends do you see in R language affecting your organization over the next year?
FM: Over the next year we believe using R to get insight into and finding solutions for Health, finance, Agriculture and the economy as a whole. With the census ongoing, we hope to get data for some of these.
RC: Do you know of any data journalism efforts by your members? If not, are there particular data journalism projects that you’ve seen in the last year that you feel had a positive impact on society?
FM: We have one member who uses data to tell stories about events that happen in Ghana. She uses it for data presentations.
RC: When is your next event? Please give details!
FM: We are having a speaker from Argentina speak. She will talk about creating packages using learnr through R. This will be in September. We also have a speaker in September from Spain who will also talk about creating a package in R as well. We will also do local programs on zoom in the meantime.
RC: Of the Funded Projects by the R Consortium, do you have a favorite project? Why is it your favorite?
FM: Interactive visualisations in R via R-to-JavaScript-transpilation.In general I like data visualization and it’s wonderful to explore.
RC: Of the Active Working Groups, which is your favorite? Why is it your favorite?
FM: R Certification. Being proficient in R will also help in our effort to spread the use of R in Ghana as a whole and it’s also a source of motivation to do more with R
RC: There are four projects that are R Consortium Top Level Projects. If you could add another project to this list for guaranteed funding for 3 years and a voting seat on the ISC, which project would you add?
FM: I think something along the lines of R Clinics to bring awareness in all tertiary institutions and industry. For instance, they could develop R clinics and workshops in Ghana that professor’s and industry players or members would use the software. Again Data journalism would be great here in Ghana
How do I Join?
R Consortium’s R User Group and Small Conference Support Program (RUGS) provides grants to help R groups around the world organize, share information and support each other. We have given grants over the past 4 years, encompassing over 65,000 members in 35 countries. We would like to include you! Cash grants and meetup.com accounts are awarded based on the intended use of the funds and the amount of money available to distribute.
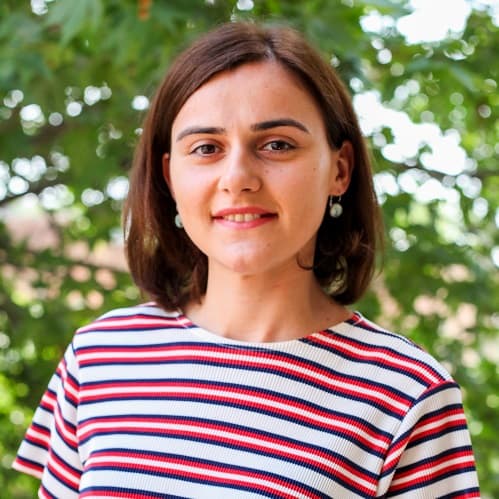
R consortium talks to Nino Macharashvili of DataFest Tbilisi (also on Facebook) on how they are dealing with life in the COVID age. As they were one of the early adopters of online conferences, having one shortly after the start of COVID, they have an interesting take on attendance. Nino also has an interesting take on a top-level project to help train more future professionals into the R language.
What is the R community like in Tbilisi?
Our event is very regional. We started DataFest Tbilisi in 2017, and it was mostly an Eastern European Union (EU) and Central Asian event. Our speakers were always from all over (North America, EU, and Asia). In the last two years, we have been online due to COVID, and our event has become more global, with more than 50 countries attending. However, we still had the biggest chunk from Eastern EU and Central Asia. Because of our location, we tend to have a manageable time zone for a global conference, with only a few people waking up early or staying up late.
How has COVID affected your ability to connect with members?
With the virus, we had to have everything go online. We were able to start experimenting with different ways to run a conference online. In the first year, for the first 2 months, we noticed that there were hardly any online events. Come March we noticed that many different events were going online. We started going in right away and ended up pioneering online conferences. We got a nice response from the audience for the first conference because we were available when many people were in a strict lockdown. We were able to offer an opportunity to connect with others in the community and learn. For me, it was a very positive experience. We wanted to be a global conference, not just for speakers but also for the audience. It was much easier to do this with online events. However, after 1 year we saw some differences, Georgia and most of the EU were going back to normal. We also noticed people didn’t want to go back on zoom due to zoom fatigue. I’d personally like to keep the conference offline, online, and hybrid.
In the past year, did you have to change your techniques to connect and collaborate with members? For example, did you use GitHub, video conferencing, online discussion groups more? Can these techniques be used to make your group more inclusive to people that are unable to attend physical events in the future?
We ended up using Zoom and a slack channel. We did look at using hopin, but we decided that simpler was for the best. So we decided to keep with the technology that most people were used to.
Can you tell us about one recent presentation or speaker that was especially interesting and what was the topic and why was it so interesting?
My favorite presentation was on Artificial Intelligence (AI) from our recent meeting. One striking fact was how the EU is racing to catch up with the US in AI and are investing heavily in it. The US is ahead, and the EU is close behind, but Georgia needs to catch up. I like it because it was a talk that brought up the issues and obstacles of AI and not just the overhyped part of AI.
What trends do you see in R language affecting your organization over the next year?
R is not the only language that is used by our members. As far as trends in coding in general, we are looking at tools that do coding themselves (self-coding code). We still need people who know how to use it and why to use it, however. We need to interest people from other sectors so we can show people how to apply the code to their field.
Do you know of any data journalism efforts by your members? If not, are there particular data journalism projects that you’ve seen in the last year that you feel had a positive impact on society?
We usually have data journalism as a track event. One of the main goals is to use data to debunk misinformation. This is one of our current projects. We have so many different projects. One of my favorite talks was a talk on COVID-19 in Brazil.
R ladies is an important program that should be kept. The R Ladies’ role is very important in popularizing R among everyone and not just in bringing in women. By making R more approachable, it increases interest in many different groups, and R Ladies has shown us that. It is important in communities like ours, where the R community is not large. It has the power to unify the groups.
There are four projects that are R Consortium Top Level Projects. If you could add another project to this list for guaranteed funding for 3 years and a voting seat on the ISC, which project would you add?
While I think R in data visualization would be a great choice, but I’m a bit biased because that is my field. However, what would be better for my area would be to provide support to start teaching R in University programs. In Georgia, there are not many people who use R. Most people learn about it from Twitter and start using it there. Some people start learning at workshops, and it slowly starts to trickle into the professional world. However, some professors are set in their ways and the software that they use. So, having support to get professors into using R and competitions for students would be very helpful. Their students will be the new professionals of the future and will push R in their jobs.
The largest data journalism conference in Latin America reaches its sixth edition in a row bringing discussions on the climate crisis, access to information, and data protection, in addition to dozens of workshops with experts.
Editor’s note: There are four R-related workshops @ Coda.Br 2021 (Data and health: Sivep without secrets, Tools to mitigate AI biases, Creating a reproducible project in R, and Graphs everywhere: how to create and analyze graphs). Please see below for details.
The conference was created by Escola de Dados (School of Data Brazil), the Open Knowledge Brasil’s data literacy program, Coda.Br is the leading data journalism event in Latin America and will be entirely online for the second year in a row, with free and paid activities.
Three main debate panels, three keynote presentations with international guests, and the final of the Cláudio Weber Abramo Data Journalism Award will be broadcasted openly and free of charge on the event’s website. Paid activities include more than 30 hours of hands-on workshops with experts in the field. The audience can join the workshops with a simple registration (from R$40) or via the Escola de Dados membership program.
Two hundred ninety-five free subscriptions will also be offered to increase the attendance of underrepresented groups. The public call is open until November 1st.
The sixth edition of the Digital Data and Methods Journalism Conference is developed with Google News Initiative and has the support of the US Embassy and Consulates in Brazil; the Hivos Foundation; the Brazilian Institute of Teaching, Development, and Research (IDP); the Brazilian Association of Investigative Journalism; the Brazilian Institute for Research and Data Analysis (IBPAD); from Insper; R Consortium and Datopian.
LAI and LGPD, book launch and climate crisis
Focusing on the complementary relationship between transparency and privacy, the first panel will discuss how public institutions deal with the Law on Access to Information (LAI) after the General Data Protection Law (LGPD) came into force in Brazil. Fernanda Campagnucci, CEO of Open Knowledge Brasil, will moderate the discussion of the following speakers Maria Vitória Ramos (Fiquem Sabendo), Jamila Venturini (Derechos Digitales), Paulo Rená (Instituto Beta).
The panel “Data Journalism in the World” marks the launch of the Portuguese version of “The Data Journalism Handbook: Towards a Critical Data Practice” with Natália Mazotte (Insper), one of the founders of the School of Data in Brazil, in addition to the participation of Cédric Lombion (Open Knowledge Foundation), Liliana Bounegru and Jonathan Gray (King’s College London).
And while the United Nations Conference on Climate Change (COP26) brings together global leaders, Coda.Br will debate the coverage of the climate emergency by journalism, pointing out problems and possible solutions in this area in the panel “Climate crisis in data journalism”. The activity will be moderated by Gustavo Faleiros (InfoAmazonia) and will feature Letícia Cotrim da Cunha (UERJ), Francy Baniwa (National Museum), and Clayton Aldern (Grist).
This year’s keynote presentations include Gurman Bhatia, an independent data visualization designer; Sondre Solstad, data journalism editor at The Economist; and Jim Albrecht, director of product management at Google. The Cláudio Weber Abramo Award for Data Journalism ceremony ends the Conference, with presentations by the finalists and the announcement of the winning projects of this edition of the award.
INFO
6th Coda.Br – Brazilian Conference on Data Journalism and Digital Methods
Date: November 8th to 13th
Value: R$40 (access to all event activities) or R$180 (one-year subscription to Escola de Dados, which allows access to the event and other benefits).
Registration and more information about the schedule:
School of Data is a global network aiming to empower citizens to contribute to the strengthening of democracies. Escola de Dados is the local chapter of this network and part of Open Knowledge Brasil (OKBR). The program trains researchers, NGOs and journalists, teaching them how to use open data to promote well-informed debates and create effective narratives for their agendas.
ABOUT OPEN KNOWLEDGE BRAZIL
Created in 2013, Open Knowledge Brasil (OKBr) is the local chapter of Open Knowledge Foundation. It is a non-profit Civil Society Organization (CSO) that uses and develops civic tools, projects, public policy analysis, and data journalism training to promote open knowledge in various fields of society.
R-related workshops @ Coda.Br 2021
Data and health: Sivep without secrets
By Carolina Moreno and Raphael Saldanha
Come learn how to analyze the most useful database to cover Covid-19 in Brazil: the Sivep-Gripe. It is using it that authorities, experts and journalists follow the trends of hospitalizations and deaths. This anonymized base is public and is available to anyone who knows how to handle large datasets. However, knowing the code to manipulate the data is not enough. In this workshop, you will have access to specific knowledge about the correct filters to be made, in addition to the dynamics of information systems and epidemiological issues that must be taken into account in the coverage.
Carolina Moreno is a senior data journalist for TV Globo. She has been a journalist since 2006, specializing in journalism editing since 2009, and has produced data-driven reporting since 2017. She covers Covid-19 pandemic data from its beginning for local and national news programs. Winner of the 2014 and 2015 Andifes Award, second place in the 2019 Impa Award. Participant in R-Ladies São Paulo since 2019.
Raphael Saldanha is a health data scientist, with PhD in Health Information and Communication from Fiocruz, one of the most prestigious health institutions in Brazil. He works on quantitative health research and the production of data visualization dashboards. He has been working with COVID-19 data since the beginning of the pandemic, building Fiocruz MonitoraCovid-19’s COVID-19 monitoring panel. He has been teaching R courses since 2010.
Tools to mitigate AI biases
By Gabriela de Queiroz e Paolla Magalhães
In this workshop, you will learn how to measure and mitigate bias in your data and models using the AI Fairness 360 open-source toolkit. You will learn which metric is most appropriate for a given case and when to use many of the different bias mitigation algorithms. The workshop will mention the R package.
Gabriela de Queiroz is a Chief Data Scientist at IBM California leading AI Strategy and Innovations. She drives the AI adoption across existing and potential customers, lead outreach strategy across our open source ecosystem and data science community. Previously she was a Program Director working on Open Source, Data & AI Technologies at IBM.
Creating a reproducible project in R
By João Santos
In corporate and scientific works we are increasingly faced with scenarios where we try to reproduce the code written by someone else and we find inconsistencies and errors. The solution to these problems lies in a series of practices and conventions that ensure that your code runs consistently. In this workshop, you will learn how to develop a reproducible project in R. We will make use of libraries and directory organization best practices, making our results permanently consistent.
João is currently a Jr. Data Engineer at Account Split. He serves as a research assistant in the Department of Political Science at Emory University, where he researches political disinformation. He is a major in International Relations at PUC-Rio, and holds the AWS Certified Cloud Practitioner certification.
Graphs everywhere: how to create and analyze graphs
By Janderson Pereira
The purpose of this workshop is to present the concepts of graphs and relational data used to identify groups and their subjectivities. The idea is to show how to extract data from social networks, especially Twitter or Youtube, and then treat them to visualize interactions in order to be able to find groups that emerge when individual behaviours are aggregated. The R language and the Gephi program will be used to create the graphs.
Janderson is a data scientist and coordinator of innovation and forecasting at Natura & Co. He is a researcher at Citelab/UFF – Research Laboratory in Science, Innovation, Technology and Education and has a major in Media Studies at the Fluminense Federal University. He develops research in the area of social network analysis, focusing on methodologies for disseminating disinformation on social networking sites.
R Consortium talks to Harvey Lieberman on their growth both pre and post COVID. They have adapted in a way that promotes R in Pharma as well as allowing them to be more inclusive.
R/Pharma is being held Nov 2-4, 2021. Register today! More information available here: rinpharma.com
RC: What is the R community like in R Pharma?
We have an amazing community! We have been able to pull together a group of like-minded people who wish to contribute to R/Pharma. Each year we hold a conference that is entirely community driven from the organizing and program committees to those who work on presentations and workshops.
As a community-led effort anyone who wants to help can do so. Last year we tried to identify people who work on R in smaller biotechs so that we do not become too polarized towards bigger pharma companies.
We also have an active slack group that helps build community.
RC: How has COVID affected your ability to connect with members?
A little history of R/Pharma so you can see how it evolved with COVID. We formed a few years ago with the main focus being holding a conference. It was clear that a lot of people were working with R in Pharmaceutical companies from early research through to production, but there wasn’t a conference focussed on this. There were many statistics-based conferences, several geared towards SAS, but nothing industry-based for R practitioners. The first two conferences we held were face-to-face at Harvard University in 2018 and 2019 with 150 attendees. It was clear that more people wanted to attend but we were limited in space. Late 2019 we started to think about how to expand, to accommodate more attendees, and then COVID hit. We quickly pivoted to a virtual event and ended up reaching far more people – with over 1000 registrations for 2020 and we are expecting more for 2021.
Our conference historically attracted attendees from USA and Europe. The benefit of going virtual is that we can bring together people from all over the World. The challenge in managing this post-COVID. R/Pharma has always strived to be a free conference without sponsors and we will be relying on our community to help put future events on in this spirit.
For 2022 we are hoping to host a hybrid event.
RC: In the past year, did you have to change your techniques to connect and collaborate with members? For example, did you use GitHub, video conferencing, online discussion groups more? Can these techniques be used to make your group more inclusive to people that are unable to attend physical events in the future?
We have an active slack group which has been growing steadily since 2018. For the conference we use a GitHub repo to archive presentations and workshops, linked to our website. We also have a YouTube channel containing recorded talks and workshops from 2020. We can look at COVID as a double-edged sword with respect to connection – we were able to reach many more people last year but we lost the interpersonal interactions. It’s important to us to be inclusive and virtual experiences break down many barriers.
With regards to the conference in 2020, we held workshops via Zoom and the main conference through the hopin platform. One way in which we promoted additional interaction was through virtual conference booths so that open source authors could showcase their packages and shiny apps. We aim to host the 2021 workshops and conference the same way.
RC: Can you tell us about one recent presentation or speaker that was especially interesting and what was the topic and why was it so interesting?
We have been blessed with so many great speakers over the past three years. In our first year Joe Cheng gave a talk on Using Interactivity Responsibly in Pharma. Joe is an amazing presenter who can take a topic that is complex and explain it in a way that everyone can understand. The R/Pharma community is amazing and we always have incredible workshops in addition to talks. One that comes to mind is Leon Eyrich Jessen’s workshop on Artificial Neural Networks in R with Keras and TensorFlow. It’s a highly complex topic which Leon teaches in a 3- or 4-hour workshop, from which you leave thinking “how can I now apply this to my own problems?”
RC: What trends do you see in R language affecting your organization over the next year?
I think the big one in Pharma, in general, is R for Submissions. This is a space that traditionally has been very heavily SAS-oriented. There is certainly a move in the industry to start to use R. It’s slow because it requires a large amount of retraining, changing infrastructure and dealing with regulations. Leaving college now, you are more likely to be an R expect than a SAS expert.
Another area of growth within the industry are shiny apps. This has democratized the ability to communicate complex statistical outputs. Couple that with shiny modules and you have the ability to build complex interactive graphical apps rapidly.
RC: Do you know of any data journalism efforts by your members? If not, are there particular data journalism projects that you’ve seen in the last year that you feel had a positive impact on society?
Externally I do not but everyone in the industry uses these as a way to communicate internally on a daily basis. I’m working in a group that has started using data stories as a way to communicate complex information in a digestable way. As a Brit I tend to read the BBC a lot and like how they are embracing data journalism. FiveThiryEight too is a great site.
RC: When is your next event? Please give details!
R/Pharma 2021 will be held from November 2-4. Workshops will be running the week before. The event is free and you can find registration details on our website at rinpharma.com.
R Ladies is my favorite, mainly because it was something very conscious. We did have an imbalance in our industry Ladies is a favorite. Our industry is trying to address a gender imbalance and R/Pharma, as an organization, is very conscious of that.
The R Validation Hub is heavily connected to R/Pharma. Having a way to validate packages is very important to our industry. Members of the R Validation Hub regularly present or host workshops at R/Pharma.
RC: There are four projects that are R Consortium Top Level Projects. If you could add another project to this list for guaranteed funding for 3 years and a voting seat on the ISC, which project would you add?
R for submissions. The R Consortium is spearheading an effort that is complex but important to our industry. Having a way to bring multiple companies together to work with regulatory bodies is essential.
How do I Join?
R Consortium’s R User Group and Small Conference Support Program (RUGS) provides grants to help R groups around the world organize, share information and support each other. We have given grants over the past 4 years, encompassing over 65,000 members in 35 countries. We would like to include you! Cash grants and meetup.com accounts are awarded based on the intended use of the funds and the amount of money available to distribute. We are now accepting applications!
ELC: We are a national organization called R Hispano that hosts activities. We have a yearly conference called Jornadas which is like a workshop. The last conference in 2019 was a proper conference and we had a lot of companies committed to the conference. We had a lot of local user R groups there as well. We had a large number of national members in the organization from the local groups: Madrid, Canarias, Murcia, Málaga, Sevilla, Córdoba, Galicia, or Castilla-La Mancha. You can find an interview with R Hispano, president of an agency in the Ministry of Economy here.
RC: How has COVID affected your ability to connect with members?
ELC: Our annual conference is held in November. In 2019 we did it in Madrid, with the collaboration of the multinational company Repsol, and we invited famous speakers like Max Kuhn, Bernd Bischl, and Jo-Fai Chow (videos available here and slides and other material available here). We planned the 2020 meeting in Córdoba, but we had to postpone it due to COVID. This year it will not be possible to hold it, so we will do it next year. To keep the community alive, last year we organized, jointly with U-TAD, a two-day online event that was quite successful (encuentRo en la fase R, encounteR in the R phase). We used the online platform of U-TAD and Blackboard collaborate. Javier Luraschi was our invited speaker, and the Ecuador R User Group organized the session. Also, the annual assembly of the association was held online, thanks to the University of Murcia Zoom platform. Definitely yes, these techniques help spread our activities and engage more people. Whenever it was possible, past annual conferences were also accessible in streaming.
The local groups have also adapted to this situation. The Canary Islands group organized a YouTube streaming event last April. The Madrid group resumed its meetings on May 26 and they share materials and videos online. The Murcia group has organized several events during the Pandemic, the last one was online, workshop videos and materials are available here). Next month, the most recent group in Castilla-La Mancha, R Quixote is hosting a workshop on R for Business, Teaching, and Research, both in-person (30 spots, filled in 24 hours) and online (unlimited)
RC: In the past year, did you have to change your techniques to connect and collaborate with members? For example, did you use GitHub, video conferencing, online discussion groups more? Can these techniques be used to make your group more inclusive to people that are unable to attend physical events in the future?
ELC: We used Blackboard collaborate to run a conference. It was what we had and it worked fine. I prefer Microsoft Teams which we use in university. Sadly, a lot of people in the R community don’t tend to have access to them.
RC: Can you tell us about one recent presentation or speaker that was especially interesting and what was the topic and why was it so interesting?
ELC: The presentation by Borja Andrino during the Canarias meetup in April was very interesting to me. He is a data analyst in the prestigious “El País” newspaper. Within the team of Kiko Llaneras, they analyze election data, and all types of data using R and other tools, and we could see how R is used in something we see every day in the news.
RC: What trends do you see in R language affecting your organization over the next year?
ELC: The new pipe in 4.1 and will it substitute or replace tidyverse. In our group, we have a lot of fans of data.table package and a lot of people use base R and a lot of people use tidyverse. Also, artificial intelligence with the new algorithms and how they are integrated into R. This is a trend that we will have to keep an eye on.
RC: Do you know of any data journalism efforts by your members? If not, are there particular data journalism projects that you’ve seen in the last year that you feel had a positive impact on society?
ELC: This is a topic that we include in many activities. At the 2019 conference, we held a round table with top actors in the Spanish scene. Not to mention the presentation by Borja remarked before.
RC: When is your next event? Please give details!
ELC: As far as the local groups are concerned, the one by R Quixote is the next meeting. The next annual conference will be held in Córdoba. We probably will have more details after the summer, when vaccination in Spain advances and we can make plans for 2022. Maybe an online event (a new “encuentRo”) will also be planned before 2021 ends.
ELC: Everything related to spatial data and analytics is worth mentioning, as “maps” is something very important for outreach, so I would say my favorite now is Spatiotemporal Data and Analytics.
ELC: Even though I have been using R in Pharma and in Business (so those groups are amongst my favorites), I would say my very favorite is the Code Coverage one. I plan to improve my SixSigma package and my developments for companies adding quality software good practices in there.
RC: There are four projects that are R Consortium Top Level Projects. If you could add another project to this list for guaranteed funding for 3 years and a voting seat on the ISC, which project would you add?
ELC: If I had to choose among the current projects, I would say “Database interoperability for spatial objects in R”, to facilitate “in production” applications of spatial analysis and visualization. If I could suggest a new project, I would support something related to R communities in production (business and/or public bodies). Similar to other community projects, people with common interests in R and their business could spread the word in sectors with high potentials, such as the food industry, manufacturing, etc. I did submit a proposal some time ago on this as well.
How do I Join?
R Consortium’s R User Group and Small Conference Support Program (RUGS) provides grants to help R groups around the world organize, share information and support each other. We have given grants over the past 4 years, encompassing over 65,000 members in 35 countries. We would like to include you! Cash grants and meetup.com accounts are awarded based on the intended use of the funds and the amount of money available to distribute. We are now accepting applications!
The deadline for submitting proposals is October 31, 2021.
The September 2021 ISC Call for Proposals is now open. The R Consortium’s Infrastructure Steering Committee (ISC) solicits progressive, pioneering projects that will benefit and serve the R community and ecosystem at large. The ISC’s goal is to foster innovation and help bring your ideas into tangible realities.
Please consider applying!
Although there is no set theme for this round of proposals, grant proposals should be focused in scope. If you are currently working on a larger project, consider breaking it into smaller, more manageable subprojects for a given proposal. The ISC encourages you to “Think Big” but create reasonable milestones. The ISC favors grant proposals with meaningful detailed milestones and justifiable grant requests, so please include measurable objectives attached to project milestones, a team roster, and a detailed projection of how grant money would be allocated. Teams with detailed plans and that can point to previous successful projects are most likely to be selected.
The Enterprise Applications of the R Language Conference (EARL) is a cross-sector conference focusing on the commercial use of the R programming language. The conference is dedicated to the real-world usage of R with some of the world’s leading practitioners. This year, it was held September 6-10, 2021.
Thank you to everyone who joined us for EARL 2021 – especially to all of the fantastic presenters! We were pleased to receive lots of really positive feedback from the online event and there are plenty of highlights to share.
Branka Subotic, NATS
It was great to kick off EARL 2021 with our first keynote of the day from Branka. She has worked for NATS since 2018 and is currently their Director of Analytics. Branka shared with us interesting ways to help teams to work together and also some unusual ways to upskill! Her talk was peppered with some videos showing us flight data and the impacts of Covid.
Chris Beeley, NHS – Stronger together, making healthcare open- building the NHS-R Community
We are always delighted to hear from the NHS at the EARL Conference and this year was no exception. We were treated to a passionate talk from Chris on how the NHS-R community has been built up over the years and how their conference has gone from strength to strength. We all know how supportive the R community can be, so it is great to see this in action.
Amit Kohli – Introduction to network analysis
Amit gave us an introduction to the principles of network analysis and shared several use-cases demonstrating their unique powers. Amit also included a fun way to interact with his talk with the use of a QR code – we can always rely on Amit to entertain us! Our team thought it was a really interesting topic and it felt accessible to those who perhaps don’t know much on the subject.
Emily Riederer, Capital One – How to make R packages part of your team
We loved Emily’s fun concept of making R packages a real part of your team and her use of code, and the choices she made along the way. Her talk examined how internal R packages can drive the most value for their organisation when they embrace an organisation’s context, as opposed to open source packages which thrive with increasing abstraction. Read our interview with Emily here.
Dr. Jacqueline Nolis, Saturn Cloud
We closed the day with our final keynote talk from Jacqueline Nolis. She is a data science leader with over 15 years of experience in managing data science teams and projects, at companies ranging from DSW to Airbnb. She currently is the Head of Data Science at Saturn Cloud where she helps design products for data scientists. Jacqueline spoke to us about taking risks in your career and shared with us the various risks she has taken over her career and how they went! It was inspiring to hear from an experienced data scientist that it’s ok to take a risk every now and then – and refreshing to hear her honesty about what could have gone better – and how she has ultimately learned and grown from this.
These are just a few of the brilliant talks from a fantastic conference day. It was a delight to have speakers and attendees joining us from across the world – so thank you again to all that came along.
We are hoping to be back in London next year to host EARL in-person again. We are tentatively holding the 6th-8th of September 2022 as our conference dates. If you’d like to keep up-to-date on all things EARL please join our mailing list. We will open the call for abstracts in January 2022.
Bilikisu Aderinto, Founder/Organizer of the Abuja R User Group and R-Ladies Abuja, talks about the lack of R User groups in her area, and her desire to start one, leading to a large increase in members in Abuja. She talks about the issues with income disparity and how it affected lockdown attendance for the group. She also talks about training others to increase their knowledge base in the area.
RC: What is the R community like in Abuja?
BA: I got involved with the R community online while learning and growing professionally as an R user. With a lot that I have learned from various communities with a presence online, I decided to look for a local community close to me. I found none and it was getting lonely as most professional groups in my community were not interested in using R as a programming language.
So, I decided to start the Abuja R user Group for my local community in October 2019. The response was great as so many members were having similar stories to mine. Most members were new to R, while others were either looking for opportunities that R would bring to their career. In the beginning, we had challenges getting to meeting places and reaching out to members but this was overcome by the positive interest shown by members as we created various committees to manage our activities. We also got support from other local communities in Nigeria.
I also went ahead to create the R-Ladies group to encourage and give more focus to the few members in March 2020 despite the lockdown.
RC: How has COVID affected your ability to connect with members?
BA: The impact of the lockdown was highly negative as it was not planned for and there was no end in sight. Virtual meetings were alien to our members and most members had difficulties getting online due to the low standard of living.
RC: In the past year, did you have to change your techniques to connect and collaborate with members? For example, did you use GitHub, video conferencing, online discussion groups more? Can these techniques be used to make your group more inclusive to people that are unable to attend physical events in the future?
BA: We shifted our monthly meetups to virtual meetings on Zoom every other month to accommodate all members. We also shared resources and attended to questions or concerns via a Whatsapp group. We also extended our invitations to the global community which boosted the participation and morale of local members.
RC: Can you tell us about one recent presentation or speaker that was especially interesting and what was the topic and why was it so interesting?
BA: Abuja R User group had the pleasure of having Dr. K.O. Obisesan from the prestigious University of Ibadan, Nigeria. He took us through Statistical Modeling in R. This got so much audience from Nigeria and globally as well.
For R-Ladies, we had the honor of having our own Julia Silge take us through steps we can take to learn and understand text mining in R. She was wonderful taking her time despite her busy schedule to attend our webinar. The audience was well spread globally.
RC: What trends do you see in R language affecting your organization over the next year?
BA: I think there is a lot to do in getting R known in our academic institutions within our local community. We have started a work plan this month on taking every member through a path from zero knowledge of R to a user of R. We are working with some organizations to support us in achieving this goal.
The impact of RMarkdown and Shiny is another focus as we explore their adoption and implementation by members within the corporate and public health organization.
RC: Do you know of any data journalism efforts by your members? If not, are there particular data journalism projects that you’ve seen in the last year that you feel had a positive impact on society?
BA: I would like to appreciate the work done by people in storybench.org. Their project on data journalism in R is applaudable as it relates to our community.
BA: The R-Ladies global project has had a great impact on me. I have benefited along with some members in the RStudio Instructor training and certification as well as their support for R-Ladies Abuja.
BA: The R Certification project is the one that attracts my interest most. I look forward to seeing future changes that would bring more value to the process and the certificate as well.
RC: There are four projects that are R Consortium Top Level Projects. If you could add another project to this list for guaranteed funding for 3 years and a voting seat on the ISC, which project would you add?
BA: I would like a project to support the inclusion of the teaching of R in our institutions and support academics and students.
How do I Join?
R Consortium’s R User Group and Small Conference Support Program (RUGS) provides grants to help R groups around the world organize, share information and support each other. We have given grants over the past 4 years, encompassing over 65,000 members in 35 countries. We would like to include you! Cash grants and meetup.com accounts are awarded based on the intended use of the funds and the amount of money available to distribute. We are now accepting applications!
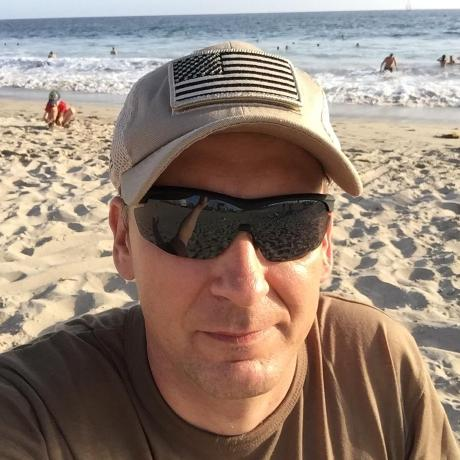
R Consortium talks to LA R Users founder Szilard Pafka about how the community started, how they adapted to the pandemic and how things have evolved in the past fifteen years for the group.
RC: What is the R community like in Los Angeles?
SP: The Los Angeles R Users Group/LA R meetup was founded in March 2009 by me, Szilard Pafka, and Professor Jan de Leeuw, the then Chair of the UCLA Statistics Department. It was not only the first R meetup in the area, but the very first data/data science meetup in LA (actually the term data science became more widely used only later). Right from this early beginning, we covered not only R, but also more broadly statistics, data visualization, machine learning, and more, all through the R language. The meetup quickly attracted a lot of people and it was one of the 3 earliest, largest, and most active R communities in the US along with San Francisco Bay Area and New York.
While the first few years the events were mostly hosted at UCLA, we moved slowly to Santa Monica startup locations (including Google) and the focus became even more on tools/techniques that can be used in day-to-day data science practice. We often had speakers from out of town including some of the fame in the R community. In 2014 we became part of DataScience.LA, a community of meetups with a website that made sharing of information and knowledge even more easily.
In 2018 a group of young organizers (Malcolm Barrett, Emil Hvitfeldt, George G Vega Yon, Keren Xu) started a separate sub-group (LA R East) with events at USC, and then in 2019, Amy Tzu-Yu Chen started LA R West. During the pandemic the events became online and while networking became more difficult, the positive side effect was that now it was easier to “bring” more renowned people as speakers.
The other side effect was that now anyone from all over the world could join the meetup and enjoy the show. In July 2021 I (Szilard) moved to Texas and the original meetup group we used for events has moved too and will do mostly online/USA rather than Los Angeles focused events, while the other organizers will continue the LA events (online for now and then in-person later under the new brand of Southern California R by joining efforts with other SoCal R groups).
RC: How has COVID affected your ability to connect with members?
SP: While moving online has had some positive side effects on the talks part, the networking part of the meetup (which is the other equally important component) has suffered. While organizers could still connect with the members, and the Q&As at the end of the talks have worked pretty well (that is members asking questions and the speakers answering), the lively/casual discussions between members after the meetup were completely missing. Over the many years previous to COVID I have heard countless stories from members about how they managed to get a job by starting chatting with employers at our events, and also the other way around (I have many friends who managed to hire great people via the meetups). Unfortunately, all this has been missing, and also the general hanging out and face-to-face meets that build up slowly but surely a community.
RC: Can you tell us about one recent presentation or speaker that was especially interesting and what was the topic and why was it so interesting?
SP: I liked James Lamb’s presentation on Writing command-line interfaces to R. The topic was interesting and very technical, but there was something to learn for people at all levels and James is a fantastic speaker.
He also gave another awesome talk at the “sister” meetup (DataScience.LA) about LightGBM (one of the most popular gradients boosting machines implementations), which was particularly interesting since James has been leading the R side of that important machine learning project (and he can be accredited with getting the library finally accepted to CRAN).
RC: What trends do you see in R language affecting your organization over the next year?
SP: I’ve been using R at the company I’m working at since 2006. While 15 years ago some of the R tools were more “rough,” even then we managed to do most of what we needed for analytics in R. We had for example machine learning models trained and running in production in R and even sophisticated graphical monitoring dashboards built with cronjobs, R, the lattice R library and HTML templates. R was already a viable and great tool for all data work 15 years ago.
Since then things in R have become even easier, more robust, and with more features. For example, shiny has made creating interactive graphical tools and dashboards a breeze. Or on the machine learning front R integrates now all the top high-performance machine learning libraries used in practice/business applications (e.g. gradient boosting machine libraries such as xgboost, lightgbm, h2o, or catboost, both on CPU and GPU, and also neural network libraries such as tensorflow or pytorch, etc). And tremendous work has been done to improve R in performance, reliability, and integration with other tools – making R even easier to use in production.
RC: When is your next event? Please give details!
SP: The part of the meetup that has moved to Texas/online/pan-USA will have its first next event in September and it will involve using R in production (stay tuned!) and I’m sure the organizers of the remaining SoCal R groups are also busy planning their next event.
SP: First of all, I have to say that it is great we have the R Consortium and the funding and we can sponsor so many projects. As for my preference, I’m really happy to see projects that improve R’s performance, speed, memory usage, reliability, integration with other tools – in a word R’s ability to compete for being the best tool for data science and for being used in production.
So my favorites from this year’s batch are “Development and maintenance of the Windows build infrastructure” and “MATTER 2.0: larger-than-memory data for R.” We need to compete with Python and be able to dispel views that R is not suitable for serious projects or in production.
SP: For the same reason as the above, my favorites are “Code Coverage,” “Distributed Computing” and “R / Business.”
RC: There are four projects that are R Consortium Top Level Projects. If you could add another project to this list for guaranteed funding for 3 years and a voting seat on the ISC, which project would you add?
SP: Tools for R in production. We need to make sure that we are seen as a viable competitor with Python for production. So, we need to have more tools to do so.
How do I Join?
R Consortium’s R User Group and Small Conference Support Program (RUGS) provides grants to help R groups around the world organize, share information and support each other. We have given grants over the past 4 years, encompassing over 65,000 members in 35 countries. We would like to include you! Cash grants and meetup.com accounts are awarded based on the intended use of the funds and the amount of money available to distribute. We are now accepting applications!