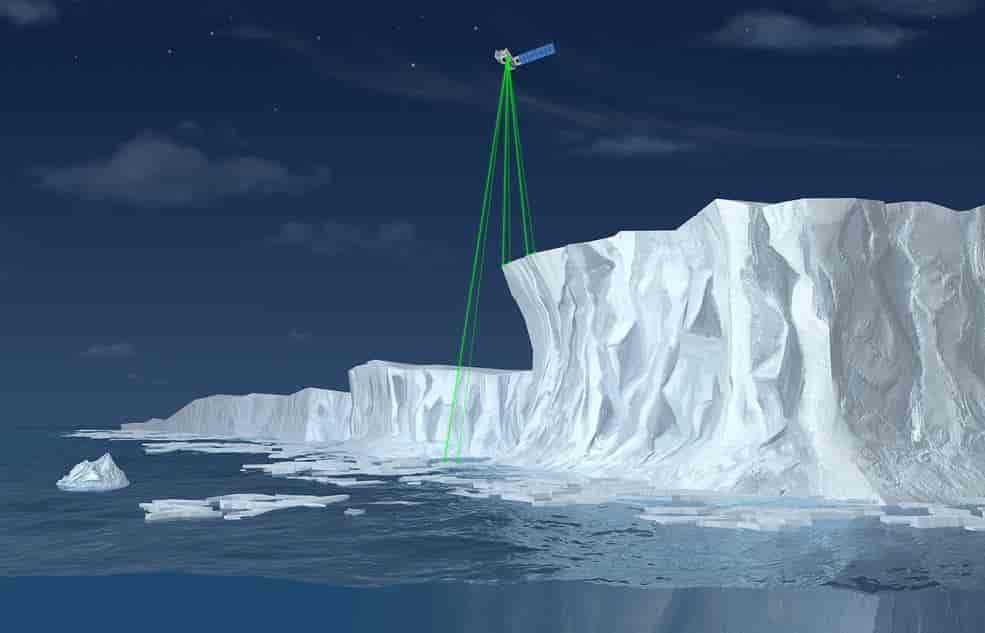
The R Consortium recently connected with Lampros Sp. Mouselimis, the creator of the ICESat2R package, discussing the ICESat-2 mission, a significant initiative in understanding the Earth’s surface dynamics. This NASA mission, utilizing the Advanced Topographic Laser Altimeter System (ATLAS), provides in-depth altimetry data, capturing Earth’s topography with unparalleled precision.
Mouselimis’ contribution, the ICESat2R package, is an R-based tool designed to streamline the analysis of ICESat-2 data. It simplifies accessing, processing, and visualizing the vast datasets generated by ATLAS, which emits 10,000 laser pulses per second to measure aspects like ice sheet elevation, sea ice thickness, and global vegetation biomass. This package enables users to analyze complex environmental changes such as ice-sheet elevation change, sea-ice freeboard, and vegetation canopy height more efficiently and accurately. The R Consortium funded this project.

Lampros Sp. Mouselimis is an experienced Data Analyst and Programmer who holds a degree in Business Administration and has received post-graduate training in Data Processing, Analysis, and Programming. His preferred programming language is R, but he can also work with Python and C++. As an open-source developer, you can find his work on GitHub With over a decade of experience in data processing using programming, he mainly works as a freelancer and runs his own business, Monopteryx, based in Greece. Outside of work, Lampros enjoys swimming, cycling, running, and tennis. He also takes care of two small agricultural fields that are partly filled with olive trees.
You built an R package called ICESat2R using the ICESat-2 satellite. Do you consider your ICESat2R project a success?
ICESat-2 R has 7,252 downloads, which, considering the smaller group of researchers who focus on using ICESat-2 data, qualifies it as a popular tool. It’s not as popular compared to some other remote sensing packages, but I believe it’s been a success based on two main points:
- Contribution to the R users community: I hope that the R programmers who use the IceSat2R R package are now able to process altimetry data without any issues, and, if any, then I’ll be able to resolve these by updating the code in the GitHub and CRAN repositories.
- Personal and Professional achievement: I applied for a grant to the R consortium, and my application was accepted. Moreover, I implemented the code by following the milestone timelines. Seeing a project through and providing it publicly is a success, I believe.
Who uses ICESat2R, and what are the main benefits? Any unique benefits compared to the Python and Julia interfaces?
The users of the ICESat2R package can be professionals, researchers, or R programming users in general. I assume that these users could be:
- Ice scientists, ecologists, and hydrologists (to name a few) who would be interested in the altimeter data to perform their research
- Public authorities or military personnel, who, for instance, would like to process data related to high-risk events such as floods
- Policy and decision-makers (the ICESat-2 data can be used, for instance, in resource management)
- R users that would like to “get their hands dirty” with altimeter data
I am aware of the Python and Julia interfaces, and to tell the truth, I looked at the authors’ code bases before implementing the code, mainly because I wanted to find out the exact source they used to download the ICESat-2 data.
Based on the current implementation, I would say that the benefits of the ICESat2R package are the following:
- The R programming users can use NASA’s OpenAltimetry interface, which, as of December 2023, doesn’t require any credentials
- The R package includes 3 Vignettes (Articles) and detailed documentation (Reference) for the implemented code
What is an interesting example of using ICESat2R?
There are many examples where the ICESat2R package can be used. For instance, a potential use case would be to display differences between a Digital Elevation Model (Copernicus DEM) and land-ice-height ‘ICESat-2’ measurements. The next image shows the ICESat-2 land-ice-height in winter (green) and summer (orange) compared to a DEM,
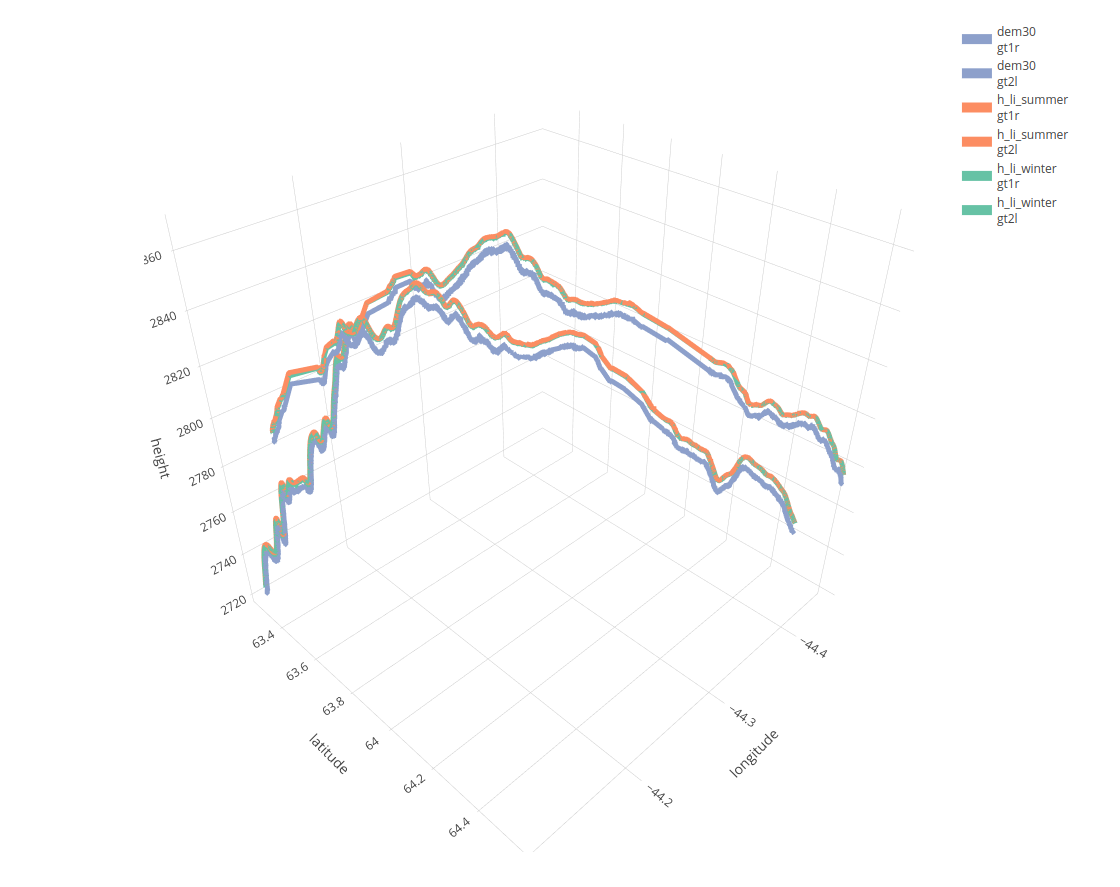
More detailed explanations related to this use case exist in the Vignette ICESat-2 Atlas Products of the package.
Were there any issues using OpenAltimetry API (the “cyberinfrastructure platform for discovery, access, and visualization of data from NASA’s ICESat-2 mission”)? (NOTE: Currently, the OpenAltimetry API website appears to be down?)
At the beginning of October 2023, I was informed that the OpenAltimetry website (previously https://openaltimetry.org/) has migrated to https://openaltimetry.earthdatacloud.nasa.gov/. I then contacted the support of the National Snow & Ice Data Center, which informed me about the migration of the API interface.
Currently, I have an open issue in my Github repo related to this migration. Once the OpenAltimetry API becomes functional again, I’ll submit the updated version of the ICESat2R package to CRAN.
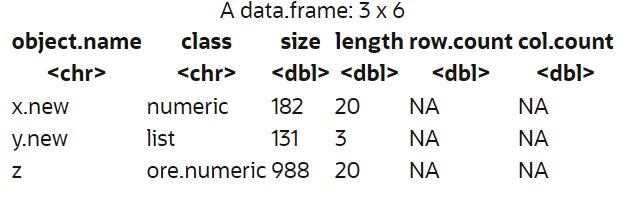
In your blog post for the copernicusDEM package, you showed a code snippet showing how it loads files, iterates over the files, and uses a for-loop to grab all the data. Can you provide something similar for ICESat2R?
Whenever I submit an R package to CRAN, I include one (or more) vignettes that explain the package’s functionality. Once the package is accepted, I also upload one of the vignettes to my personal blog. This was the case for the CopernicusDEM R package,
but also for the ICESat2R package,
The current version of IceSat2R on CRAN (https://CRAN.R-project.org/package=IceSat2R) is 1.04. Are you still actively supporting IceSat2R? Are you planning to add any major features?
Yes, I still actively support IceSat2R. I always respond to issues related to the package and fix potential bugs or errors. The NEWS page of the package includes the updates since the first upload of the code base to Github.
I don’t plan to add any new features in the near future, but I’m open to pull requests in the Github repository if a user would like to include new functionality that could benefit the R programming community.
About ISC Funded Projects
A major goal of the R Consortium is to strengthen and improve the infrastructure supporting the R Ecosystem. We seek to accomplish this by funding projects that will improve both technical infrastructure and social infrastructure.