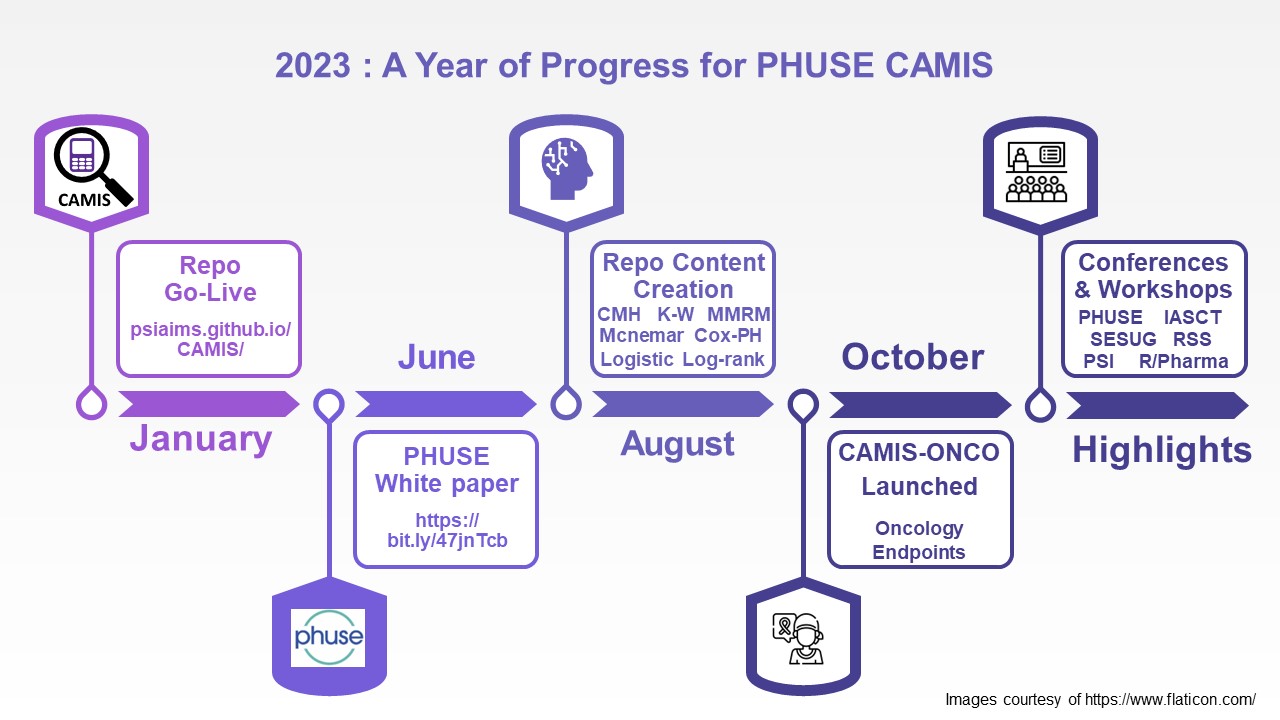
As we draw towards the end of 2023, the PHUSE CAMIS Working Group reflect on their key progress and successes this year.
The CAMIS repository went live in January 2023, drawing on the content from the PHUSE CSRMLW project. This searchable repository compares analysis method implementations in software (CAMIS) such as SAS, R and python.
The White Paper was published in June, which highlighted the importance of clearly specifying your analysis, such that it can be replicated in different software, and isn’t relying on default options which can be different.
For more complex analyses, it can still be hard to understand what defaults and algorithms your software is using, so the team focused 2023 on expanding our repo content, comparing SAS vs R methods. By August, we had covered the following topics in the repo: quartiles, rounding, anova, mmrm, cmh, log-rank, cox-ph, mcnemar’s test, kruskal-wallis test and logistic. October saw the launch of the sub-working group: CAMIS-Oncology, led by Somasekhar Sriadibhatla (AstraZeneca). This team will focus specifically on oncology endpoints and analyzing them in SAS, R and Python. The CAMIS team have expanded in membership during 2023 presenting at numerous conferences around the world. In November, we welcomed Harshal Khanolkar (NovoNordisk), to join the leadership team alongside Christina Fillmore (GSK) and Lyn Taylor (PAREXEL). Our focus for 2024, will be on the creation of additional content for the repo, and sharing awareness of the project across the medical research and wider community. We’d like to take this opportunity to thank all of our team members and contributors, and encourage everyone to check out the repository and help us to grow our content CAMIS (psiaims.github.io). If you would like to join the team please get in touch through the repo.
The R Consortium recently caught up with Bilikisu Wunmi Olatunji, founder of the Abuja R User Group and R-Ladies Abuja. Bilikisu shared they began conducting in-person meetups last month by adding new types of gatherings, such as focus groups, quarterly workshops, and more. The October event was a success, as the group now has members from diverse fields, including a lawyer. Currently, the group is planning more exciting events for the upcoming year.
It’s great to reconnect with you too! Since our last interview in September 2021, our local meetup group has seen some exciting developments. We’ve continued to grow our community with members from within and outside our local community, and we have had both local and international speakers who have supported us by honoring our invitation to speak during our meetups, which led to more engaging and beneficial experiences for our members.
Last month, we had our first in-person meetups since the COVID-19 lockdown. This has led to some significant changes to the expansion of our event offerings. We’ve added new types of gatherings, such as focused groups (Data science and analytics with R, Epidemiology, Econometrics), quarterly workshops, and hybrid meetups, to cater to our community’s broader range of interests. These additions have received a very positive response, and we’re looking forward to increased participation and impact for our members.
To maintain momentum, we’ve utilized WhatsApp groups and established focused subgroups for Data Science and Analytics, Physiology, and Economics, allowing continuous engagement and specialized discussions.
We’re piloting an on-site group starting today and plan to expand access in January. The next six weeks, leading up to Christmas, are a trial period for this new approach. Beginning in January, we aim to scale this prototype, enhancing our support for the community.
We also appreciate the grant we got from R Consortium this year to support our group. Thank you, R Consortium.
In summary, we’re moving towards study groups, quarterly hybrid meetups, and workshops that will continue to serve our local community effectively. We’re excited about what’s ahead and look forward to the positive changes these plans will bring.
We want to get to know you more on the personal side. Can you please tell me about yourself? For example, hobbies/interests or anything you want to share about yourself.
Sure, I’d be happy to share a bit about myself. I am Bilikisu Wunmi Olatunji. I’m happily married and blessed with wonderful children, both sons and daughters. Although my work often keeps me very busy, in my downtime, I have a passion for the arts — I particularly enjoy drawing. Another one of my pleasures is savoring delicious food. I’m not much of a cook, so I relish the opportunity to dine out with my family and explore different cuisines.
When relaxing at home, I love spending quality time with my kids, often watching cartoons or movies. These moments are special to me as they allow us to laugh and enjoy each other’s company.
These are aspects of my life that I usually keep private. Professionally, I’m a data scientist and the founder of Abuja R User Group and R-Ladies Abuja. I work closely with other co-organizers to help develop and expand our community.
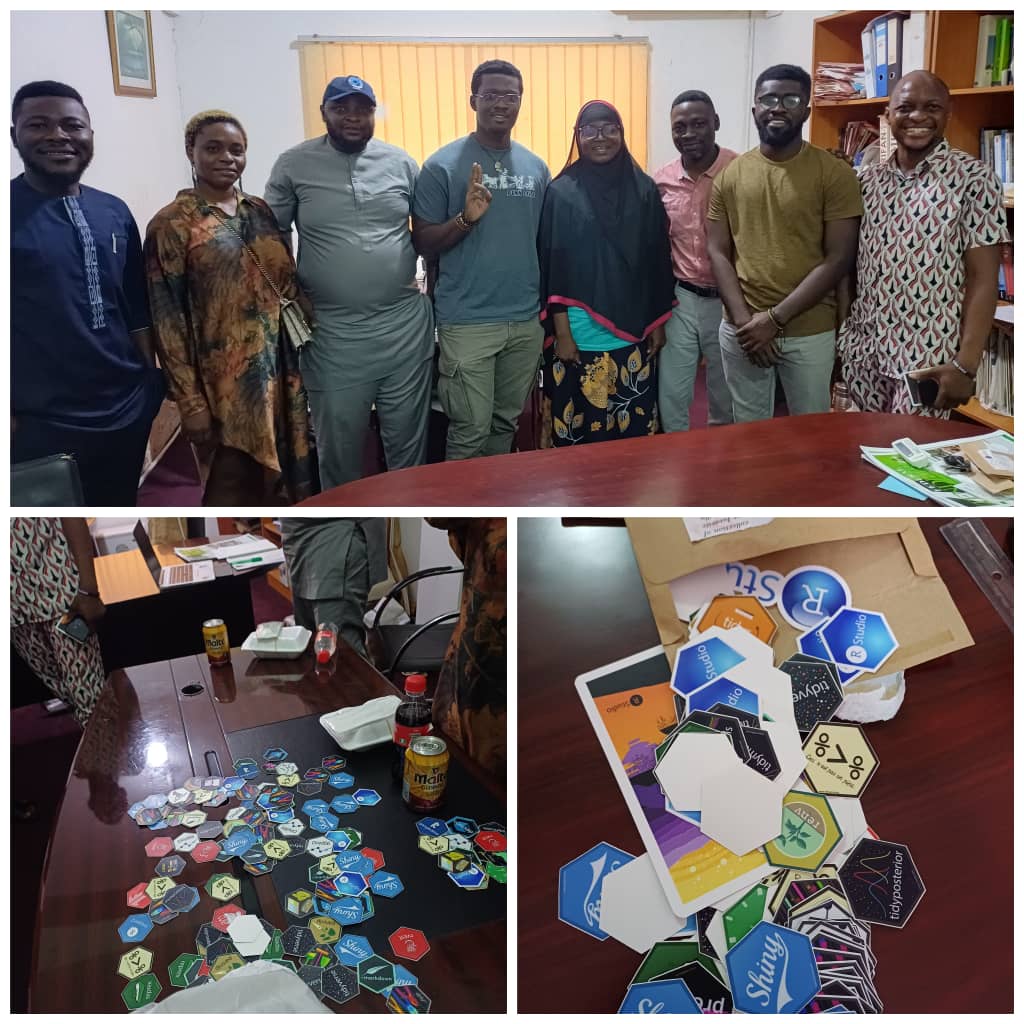
You held a Meetup on Abuja R User Group Meet & Greet on Oct 28th, 2023. Can you share how the event went? What kind of topics were covered? Why those topics?
Yes, we had our first in-person meetup since the COVID-19 lockdown. The primary goal of the meetup is to meet each other and know what the members want from the group moving forward. We had new members who attended the meetup, and most of our old members also called in to show their support. We discussed the challenges the group and the members face, e.g., attending in-person meetups. I found the event to be a positive experience that will motivate me and others to help improve the groups’ meet-up attendance. A fun suggestion from our members was to involve dancing and more enjoyment in our meetups.
Who was the target audience for attending this event?
Our focus is on academics, particularly those in statistics and computer science, which aligns well with our area’s abundance of educational institutions. However, integrating our work with schools has been challenging due to bureaucratic hurdles, making it time-consuming and stressful.
Despite these obstacles, we’ve made some progress. We managed to have academic participation in our events—for instance, Muhammed Tahir Muhammed, a statistics lecturer from our network. We also had a representative from the field of epidemiology named Isaac Joseph, the department director.
We’re excited about the potential for collaboration with these academics and professionals. At a recent event, we were pleased to see participation from three professionals from different fields, a new record for us. Among them was a lawyer, Michael Ezeh, who has experience with data visualization tools like Power BI and Tableau. He’s keen to expand his programming knowledge, starting with R, which is encouraging. We also had the following new members: Obaniyi Fidelis (Economics), Mafiana Ifechi (Data Analyst), and Benedicta Amarachukwu (New to R Data Analyst).
We’re running small focus groups as a pilot, which we hope to launch by January. The diverse backgrounds of our attendees are promising, and they will likely attract even more participants to our community.
Any techniques you recommend using for planning for or during the event? (Github, zoom, other) Can these techniques be used to make your group more inclusive to people unable to attend physical events in the future?
I recommend Zoom meetings and Github. They are both easy to help regarding collaboration and resource sharing.
When is your next event? Please give details!
We will be starting our focus groups in January. We are currently using the remaining days of this year to plan for 2024.
Please share any additional details you would like included in the blog.
We’re excited and hopeful that we will be able to impact the community with much more coming next year. We’ll be able to reach out to more people. As shown in our pictures, we have a fun time. I can also say that our numbers on the Meetup group are growing, which makes me happy.
How do I Join?
R Consortium’s R User Group and Small Conference Support Program (RUGS) provides grants to help R groups worldwide organize, share information, and support each other. We have given grants over the past four years, encompassing over 65,000 members in 35 countries. We would like to include you! Cash grants and meetup.com accounts are awarded based on the intended use of the funds and the amount of money available to distribute.
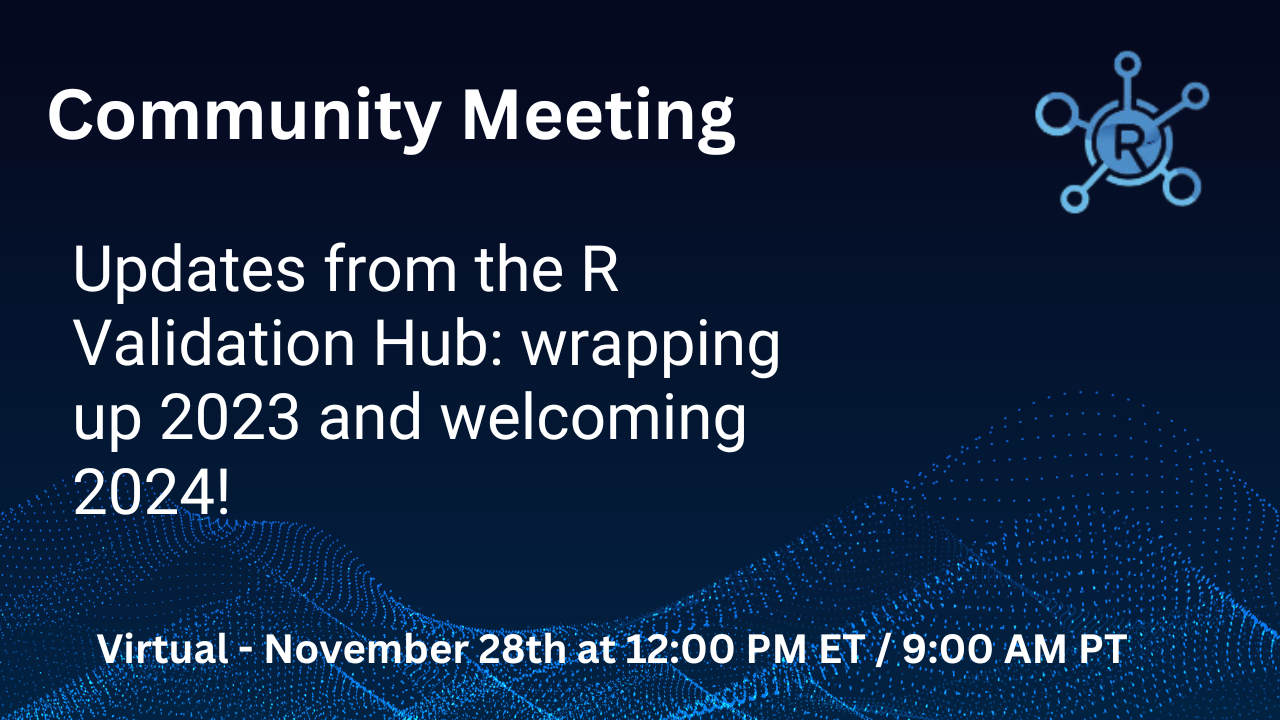
Join us on November 28th for our last Community meeting of 2023. The R Validation Hub’s Executive Committee will summarize this year’s achievements, our presence at conferences and other key moments to celebrate.
Agenda:
Looking Back on 2023 (20 minutes): Review the year’s highlights, including conferences and working group summaries.
Focus of the Reg R Repo Working Group (20 minutes): Insights into the group’s initiatives and achievements.
Open Discussion (20 minutes): An interactive session for feedback and community engagement.
Conclusion:
Don’t miss this opportunity to reflect on 2023 and contribute to shaping our direction for 2024. Join us for a session filled with insights, networking, and community spirit.
The R Consortium recently spoke to Simisani Ndaba, Founder and Organiser of R-Ladies Gaborone. Since the last time we spoke to R-Ladies Gaborone, Simisani has expanded the group to other parts of the world using platforms like WhatsApp and Fosstodon. Moreover, R-Ladies Gaborone has collaborated with chapters from Brisbane, Nairobi, Rabat, Cologne, and Damman.
Since last year’s event, we started an R-Ladies Whatsapp group from the feedback we got from the workshop. The participants talked about how a lot more people would have known about our functions and could get in touch with us directly if we had a WhatsApp group. Currently, we have members from around the world in this group, and it’s been a successful way to keep everyone informed. The chapter also has a Fosstodon account because we can reach people in the open science community. This initiative has played a significant role in growing our chapter both in Botswana and regionally in Namibia and Zimbabwe.
The chapter also has a new website which has all our material from our past events, our activities, and R related work around Botswana. The website is part of our focus on raising awareness of how R is used in Botswana and how people can get regional online content. The website is online and is updated regularly.
Our founder and co-organizer, Simisani Ndaba, was chosen as an opportunity scholar and represented the chapter at the 2023 posit conference in Chicago. She got to meet all the other R-Ladies chapters we had met online, collaborated with, and had communicated on the R community Slack channels.
Posit Conference 2023 Opportunity Scholars
Please share your background and involvement with the R-Ladies Gaborone group.
I have a Masters in Computer Information Systems and a Bachelors in Business Information Systems. I also have a Post Graduate Diploma in Teaching in Computer Science. I have been working as a Teaching Assistant since 2016 at the University of Botswana and have been in research for the same amount of time. My interests are in Machine Learning and Data Science. I recently wrote a paper on A Review of the use of R Programming for Data Science Research in Botswana to raise awareness of the use of R in Botswana academia. I believe it is an interesting read for people who are interested in Rs’ use in the rest of the world and possibly form potential collaborations. I became a Carpentries Instructor in June 2022, which allowed me to use and reference the Carpentries material for the workshop last year.
Shifting gears to more personal endeavors, I founded R-Ladies Gaborone in September 2021. At that time, I was between jobs and seeking a productive way to spend my time. My exposure to R came in 2019 at the CoData RDA summer school in Italy. Leveraging that experience, I began hosting events and collaborating with the Botswana R user group. I have organized events with chapters from Brisbane, Nairobi, Rabat, Cologne, and Damman.
Can you share what the R community is like in Gaborone, Botswana?
There are only two R community organizations, Botswana R User Group and R-Ladies Gaborone, so the R community is not large. However, there is a passionate interest among the R enthusiasts. I believe the enthusiasm comes from knowing about Rs’ use in Data Science, a growing skill in the job market. They want to improve their data analysis skills and appreciate the local R communities that provide beginner-friendly teaching material, project work, and R-related webinars from around the world.
ChatGPT is a Generative AI app that generates new data from user prompts. Generative AI is ubiquitous with ChatGPT, DALL-E, Perplexity, Bard, and others. All these apps use Large Language models which involve training Deep Learning models, particularly Neural Networks, to generate similar new data used to train the models. There have been many workshops and talks on how Generative AI has been used to create stories, in student assignments and coding in different languages, but the impact in Data Science has not been talked about enough. Questions like, will there be any addition or removal from the Data Science workflow because of simplicity or redundancy?
Who is the target audience for attending this event?
Anyone interested, who works with and is enthusiastic about Generative AI. Students, researchers, the academic community, and anyone with access to Zoom (Laugh Out Loud). We encourage people from all walks of life to attend because such discussions affect them in their daily lives and are not just for people who are in STEM. The session recording can be found below.
How CHATGPT affect the future of Data Science
Any techniques you recommend using for planning for or during the event? (Github, zoom, other) Can these techniques be used to make your group more inclusive to people unable to attend physical events in the future?
announce events and register participants. There is also a section on Meetup where we can add the Zoom link for online events and site locations for in-person activities. The Zoom account is an R-Ladies account, which allows us to go up to 2 hours rather than the 40-minute (10 minutes free) link. I would highly recommend using Meetup.com because it also has a functionality where you can communicate with all the members through email and shows you other related activities happening in your area.
During the events, we record our sessions and upload them either to the R-Ladies Global YouTube channel or our own R-Ladies Gaborone Youtube Channel. Thanks to R-Ladies Global, they make it possible to use these resources, and unfortunately, communities that do not have support may have to budget for their activities. Since our chapter started during COVID-19, we began and continued having events online. We can reach many people worldwide through online events and gain incredible insight from different perspectives because of their project experiences. Our future plans are to have in-person meetups to engage with our local community.
Please share any additional details you would like included in the blog.
Simisani Ndaba at the 2023 posit conference, Starting from the far left, Riva Quiroga (R-Ladies Santiago & Valparaíso co-founder), Mouna Belaid (R-Ladies Global team member & R-Ladies Paris organizer), Bilikisu Wunmi Olatunji (R-Ladies Abuja founder and co-organiser), Simisani Ndaba (R-Ladies Gaborone) and far right, Yanina Bellini Saibene (R-Ladies Leadership Team & rOpenSci Community Manager)
How do I Join?
R Consortium’s R User Group and Small Conference Support Program (RUGS) provides grants to help R groups worldwide organize, share information, and support each other. We have given grants over the past four years, encompassing over 65,000 members in 35 countries. We would like to include you! Cash grants and meetup.com accounts are awarded based on the intended use of the funds and the amount of money available to distribute.
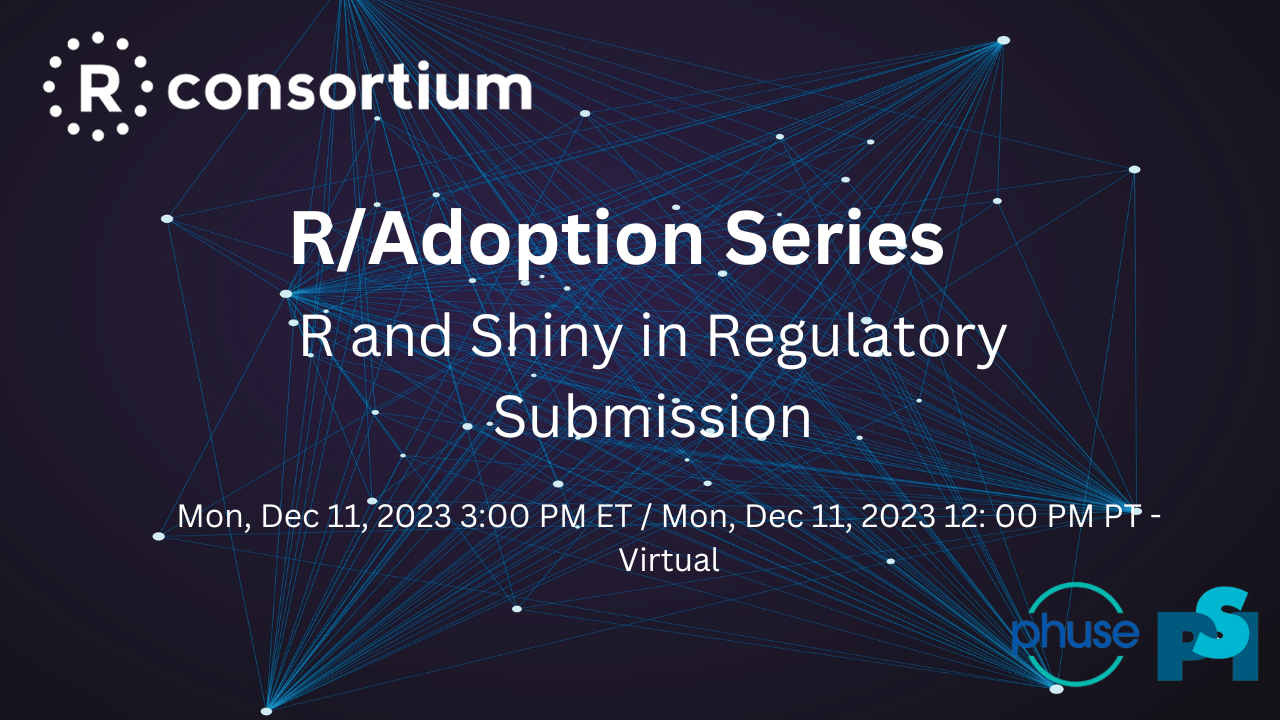
Are you an analyst, statistician, or data science enthusiast keen on understanding how open source software like R shapes the future of regulatory submissions? This webinar is for you!
“R and Shiny in Regulatory Submission”
When: Dec 11, 2023
Time: 3:00 p.m. – 4:30 p.m. EDT
Duration: 1.5 hours
Where: Zoom – Virtual Event
Hosts: FDA Statistical Association and R Consortium
Agenda Highlights:
Opening Remarks by Ning Leng, People and Product Lead in Product Development Data Sciences at Roche.
Presentation on Open Source Software for Regulatory Submissions by Paul Scheutte, FDA.
Dive into R Consortium R Submission Pilot 2 with Eric Nantz from Eli Lilly. Discover how an R-based submission with a shiny component unfolded.
Reviewing Experience of R-based Submissions with Hye Soo Cho, FDA. Understand the nuances and challenges faced during the review process.
Interactive Panel Discussion moderated by Ning Leng. Join Paul Schuette, Hye Soo Cho, and Eric Nantz as they delve deep into the R adoption journey and discuss practical challenges and solutions.
Why Should You Attend?
The data science world is rapidly evolving, and R is at the forefront of this transformation. With a robust open source community backing it, R brings many cutting-edge statistical tools—a standout feature. R shiny offers unparalleled flexibility and interactivity, revolutionizing how data scientists operate. Recently, the R consortium broke new ground by introducing a Shiny component in a submission package, a pivotal moment marking the fusion of open source capabilities with formal regulatory processes.
In the upcoming webinar, the FDA and industry speakers will share their unique experiences with R-based and shiny-based submissions. Whether you’re an industry professional or an aspiring data scientist, this is an opportunity to stay ahead of the curve.
Conclusion
Integrating open source software in regulatory processes represents a leap toward more transparent, efficient, and adaptable systems. Don’t miss this golden opportunity to learn, interact, and contribute to this transformative journey.
The R consortium R adoption series is a curated set of webinars focusing on the growing adoption of the R programming language in the data science community. Each webinar provides insights through a compelling case study and offers an interactive platform for attendees to pose questions and learn. This series is a collaborative effort by the R consortium, PhUSE, and PSI. Dive deep into the series here: R-Adoption Webinar Series.
This blog post contributed by Mouna Belaid, on behalf of the R-Ladies Paris team
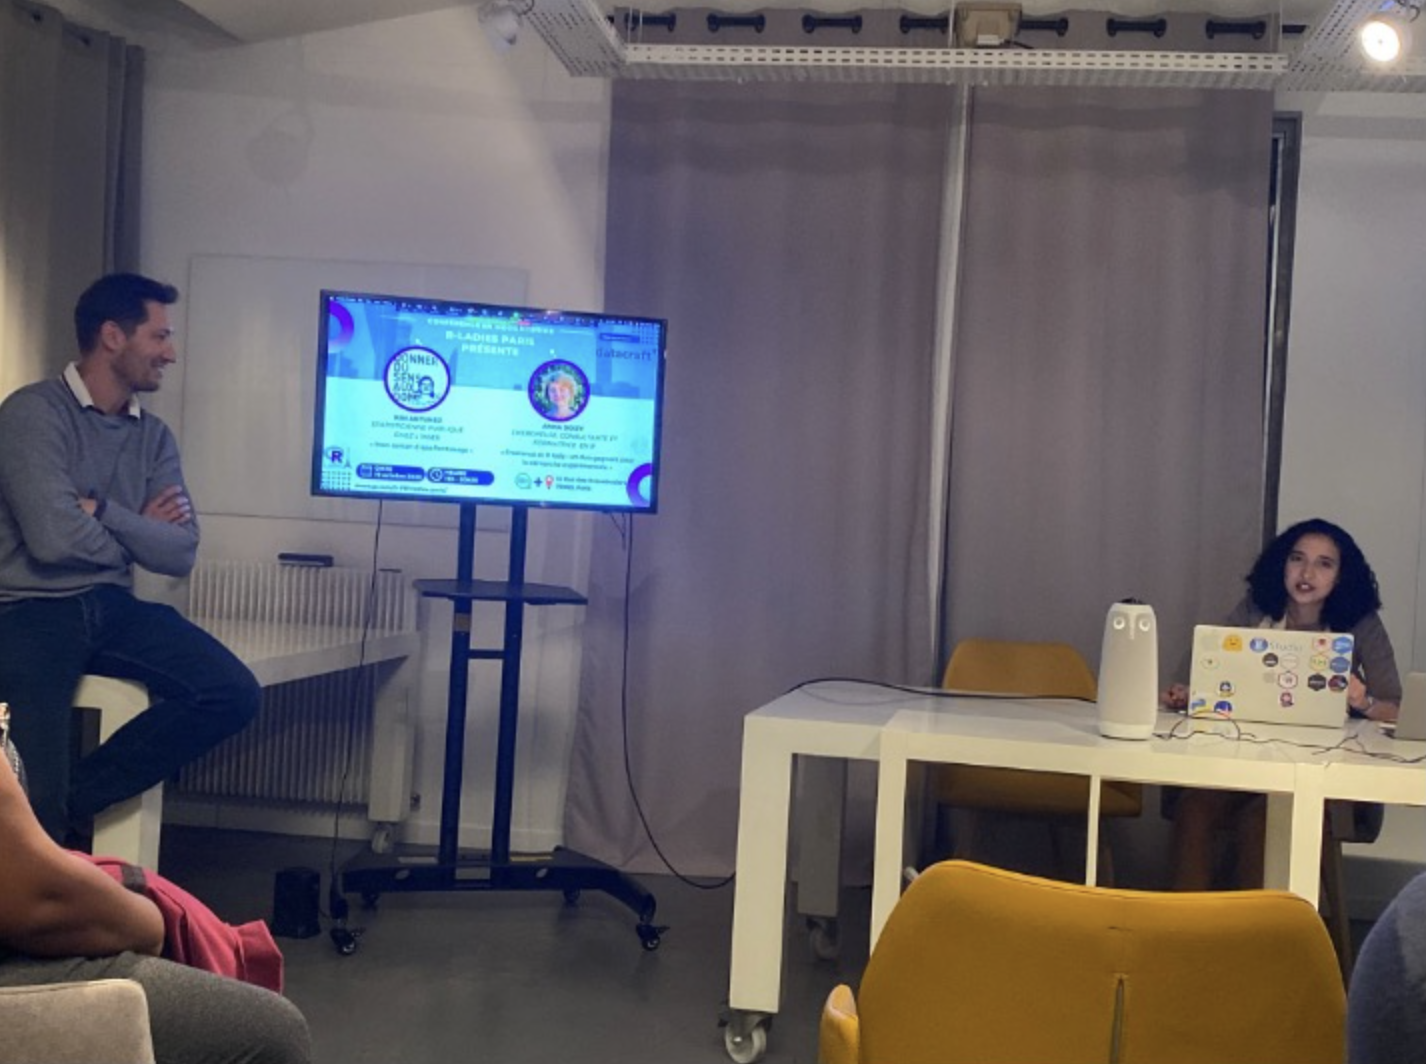
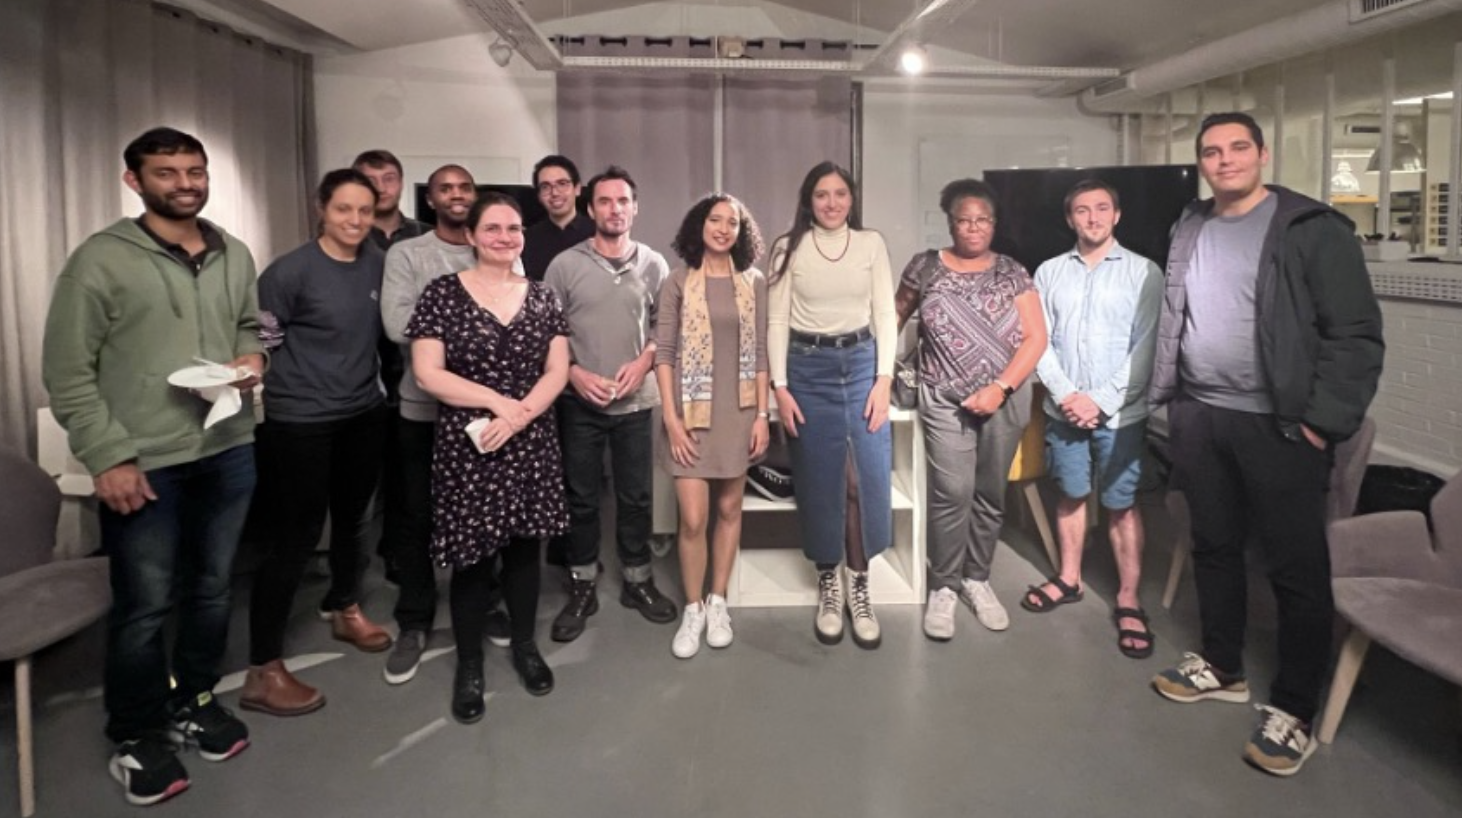
We were delighted to host a recent hybrid event called Feedback from Experiences in Data Science and Scientific Consultation on October 19 at R-Ladies Paris (in French). We were delighted to invite two amazing speakers: Anna Doizy, a researcher, consultant, and trainer specializing in experimental methodology and data analysis using R, and Kim Antunez, a public statistician at INSEE – The National Institute of Statistics and Economic Studies. Both speakers delivered their presentations in French, providing valuable insights and knowledge to our diverse audience.
We regularly post updates about our upcoming events on our Meetup group. Everyone is welcome to join us there.
We are grateful for datacraft for hosting our event. The venue was well equipped with large screens for the virtual part of the meetup, ensuring a smooth experience for our attendees.
Before starting the presentations, we initiated the recording to make the content accessible. We also went live on our Facebook page, underlining our commitment to inclusivity and ensuring that a wider audience could engage with the event.
Many Contributions Made an Excellent Event
Chaima Boughanmi, a Data Scientist at ExpandedBM – BVA and organizer at R-Ladies Paris, opened the conference and introduced the R-Ladies Paris community and our guest speakers.
Then Xavier Lioneton, COO at datacraft, provided an insightful introduction about datacraft, which is a learning and coworking club for data scientists. Furthermore, they offer an exciting agenda with upcoming data science-related events. If you’re interested, we highly recommend exploring their agenda to stay informed about their upcoming events.
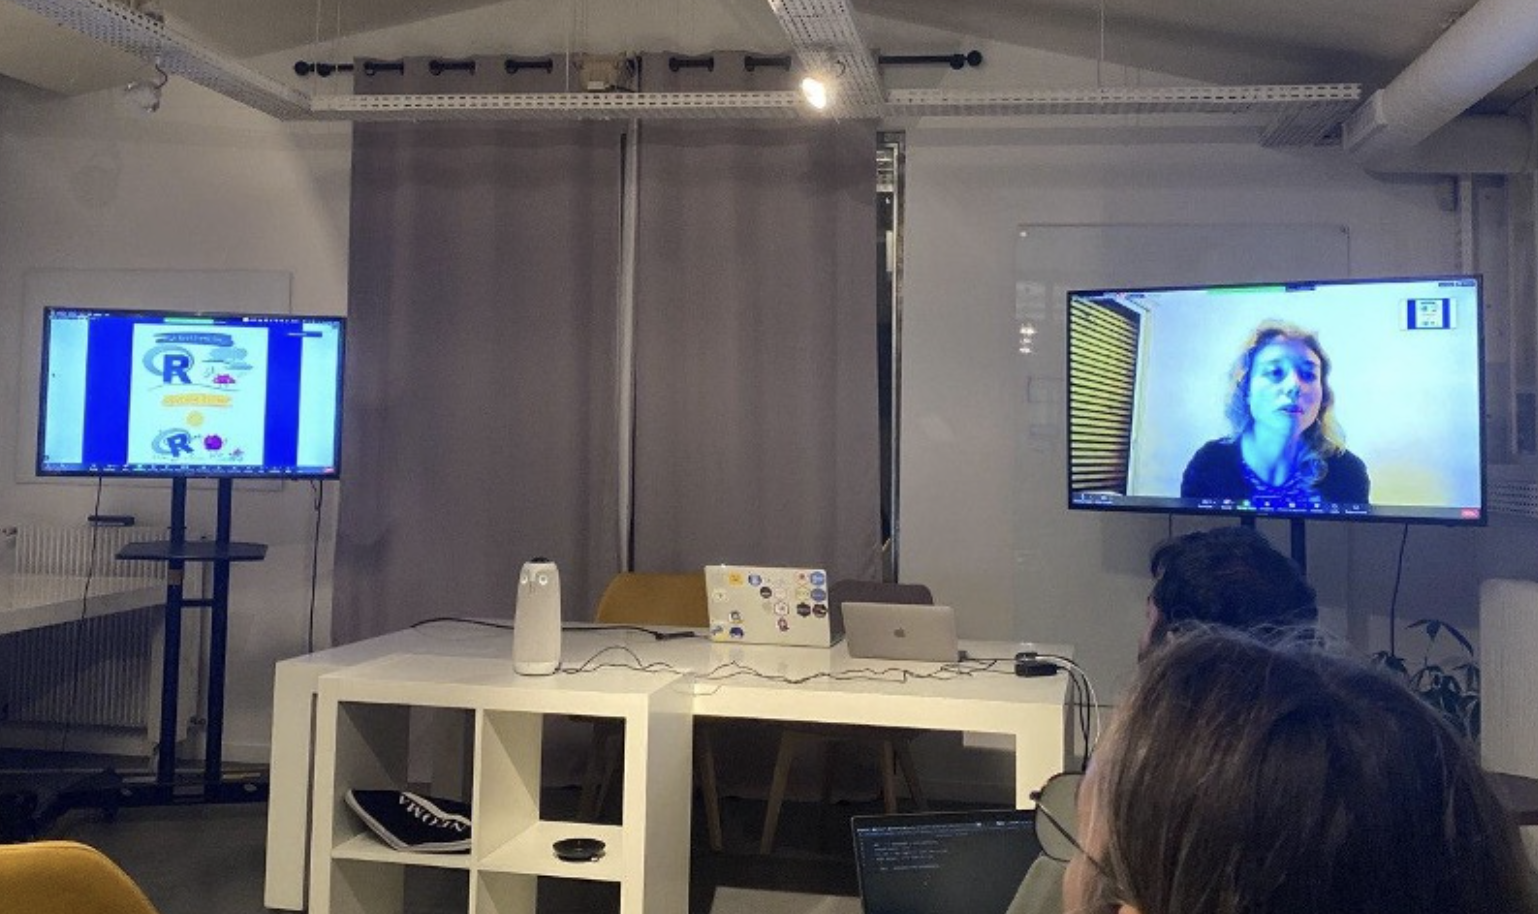
Following the warm introduction to our community, Anna Doizy started her presentation virtually, through the discussion about her scientific projects and her journey as a freelancer for the past three and a half years. She shared her transition from the role of a “biostatistician” to the one of a “scientific consultant” and delved into the challenges she faced while establishing her own company. Anna’s talk also covered her valuable contributions in helping researchers to enhance their experimental approaches.
Her talk was truly impressive.
To ensure the smooth flow of the event, the question and answer session was moderated by Mouna Belaid, an R Consultant at ArData and an organizer at R-Ladies Paris, alongside Chaima Boughanmi.
Then came the turn of our second invited speaker, Kim Antunez, who delivered a live presentation titled “Mon roman d’appRentissage (My LeaRning Novel).” She began by introducing herself by identifying as an R Lady, a title she has proudly earned. Kim then took us on a journey through the eight years she spent developing her skills in the field of data science.
Kim impressed us with stories of her personal experiences, including her work with R Shiny applications, the development of R packages, and her contributions to community presentations, which showcased her dedication and accomplishments.
Following Kim’s presentation, we facilitated a second round of questions and answers, which provided an invaluable opportunity for the audience to delve even deeper into Kim’s experiences.
In the closing session, Chaima Boughanmi gave an overview of the upcoming meetups at R-Ladies Paris :
Afterwork collaboration with PyLadies Paris. We got together at a cozy bar in central Paris to discuss all things Python and R on October 24. We always look forward to collaborating with PyLadies communities. You can also find a collection of replays of talks and workshops where we brought both communities together to explore and execute similar tasks in Python and R
Upcoming Presentation – “Glitter Makes SPARQL: A French R Package for Exploring and Collecting Data from the Semantic Web”: The presentation will be in French and led by Lise Vaudor on November 14 at 12:30 pm CET
Following the talks, we set aside some time for networking and meaningful exchanges among our community members.
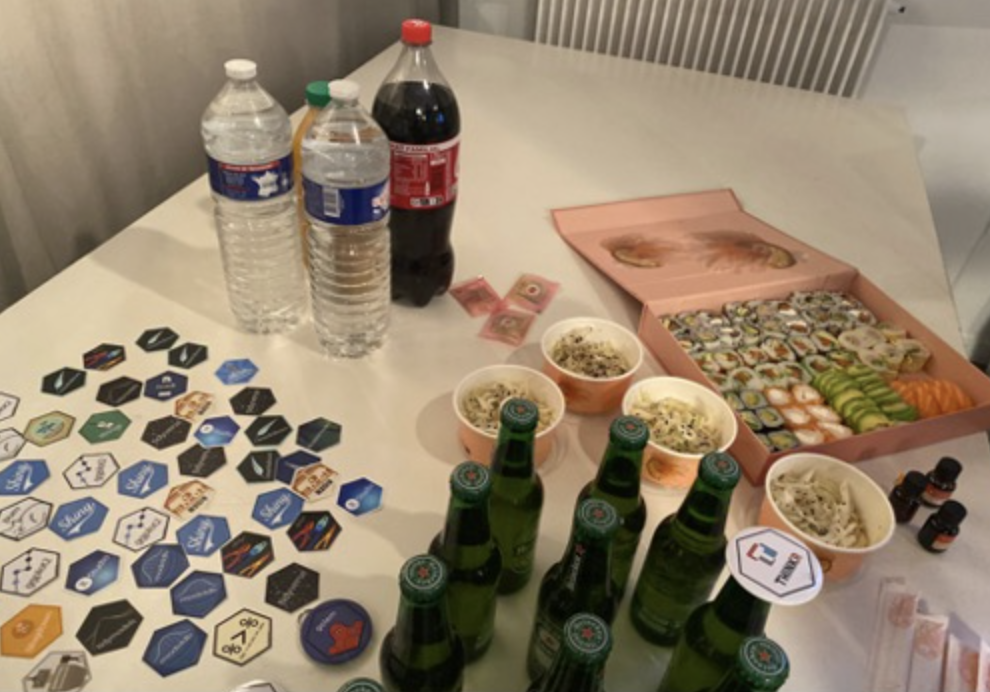
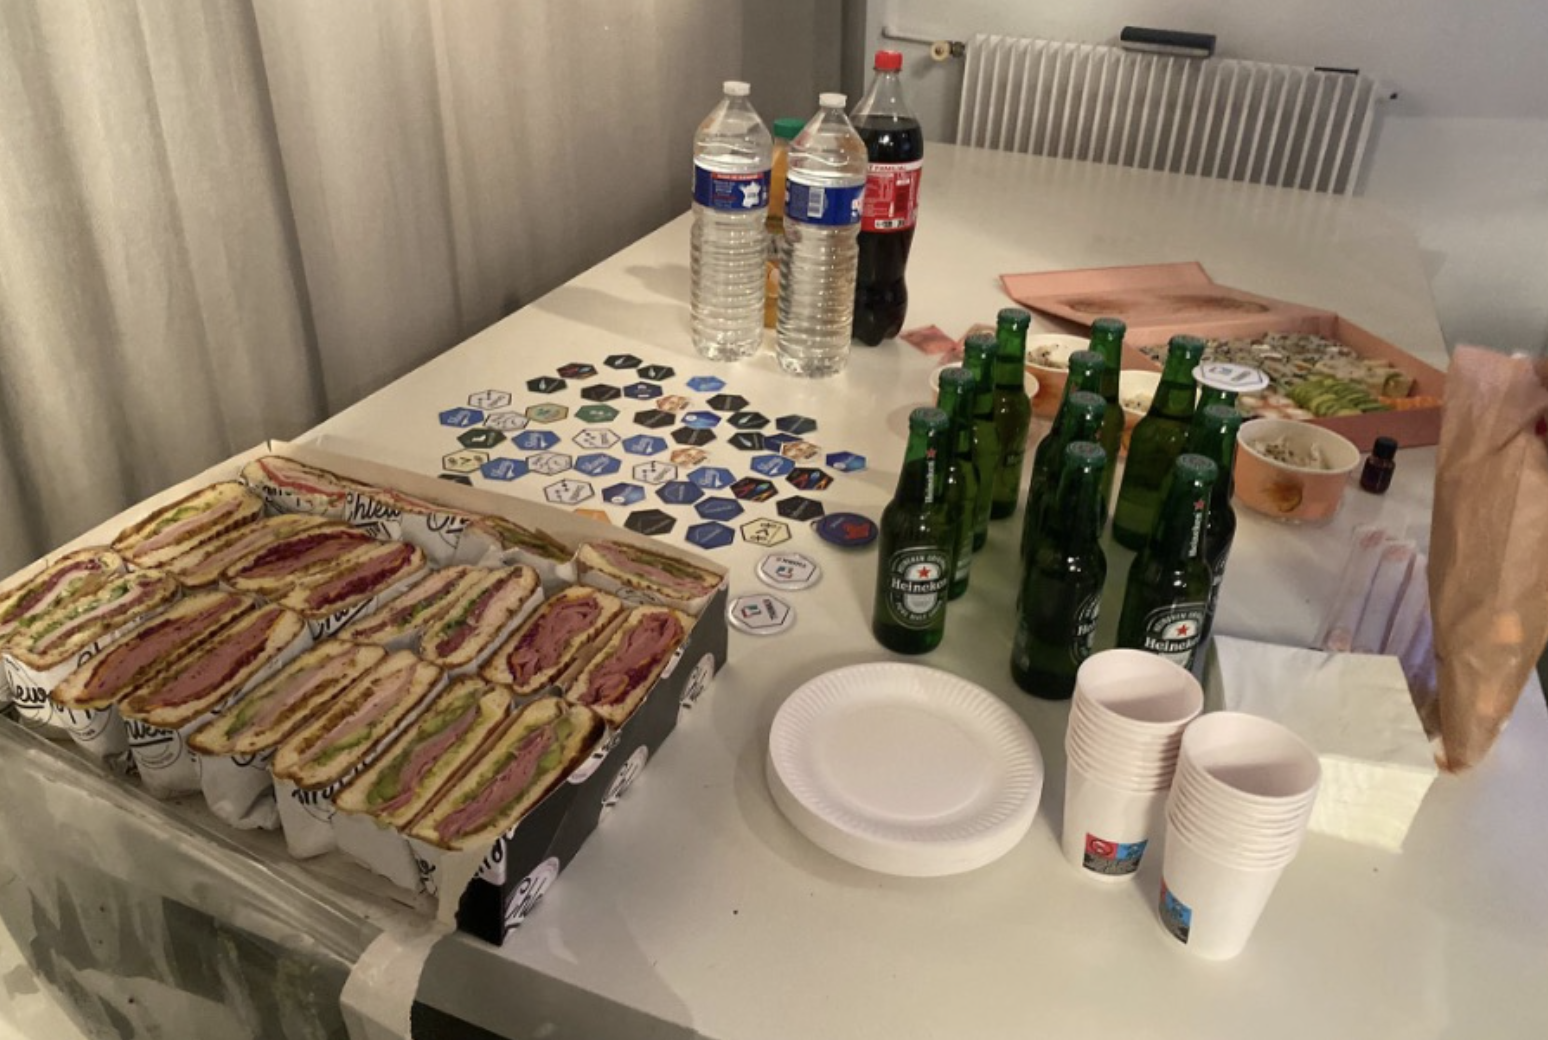
Our gratitude goes out to Posit for their contribution of fantastic R stickers, which we were thrilled to offer to our community members.
We also had the pleasure of enjoying delicious sandwiches from Chlew and sushi from Bozen which we highly recommend.
We want to express our appreciation to the R Consortium, whose grant made it possible for us to host this event and provide an opportunity for the exchange of knowledge and ideas.
This event provides the perfect setting for R enthusiasts to meet each other and share their experiences.
For those who missed the event or wish to review the talks, a video recording is available.
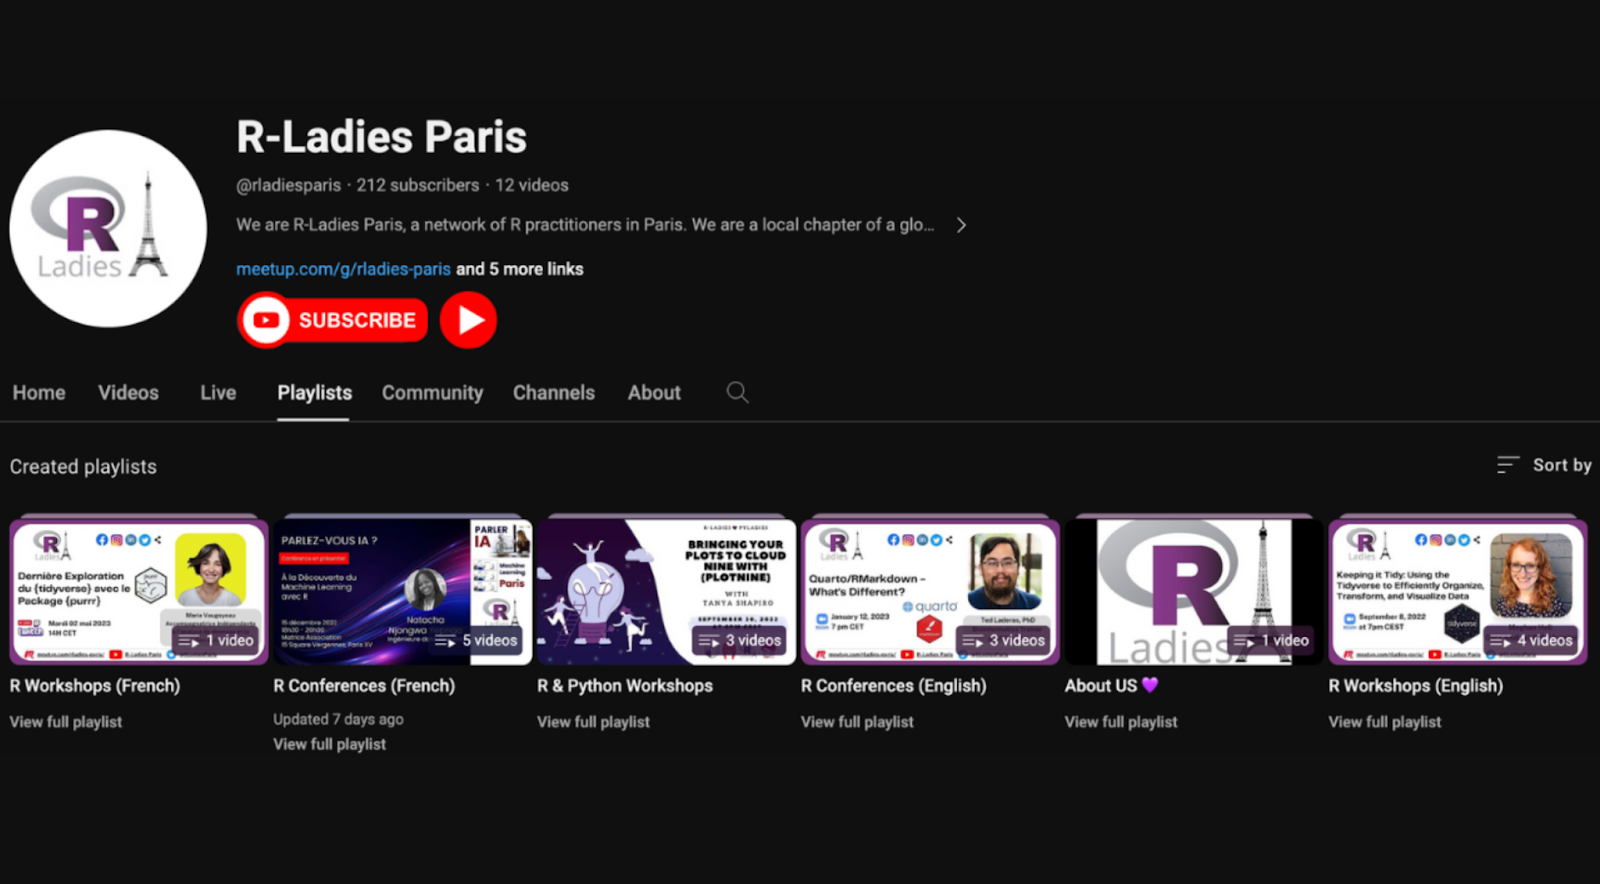
You may also find replays of our previous meetups organized into playlists on our YouTube channel.
If you’d like to join us as a speaker or have any questions, please don’t hesitate to reach out to us at paris@rladies.org. We look forward to hearing from you!
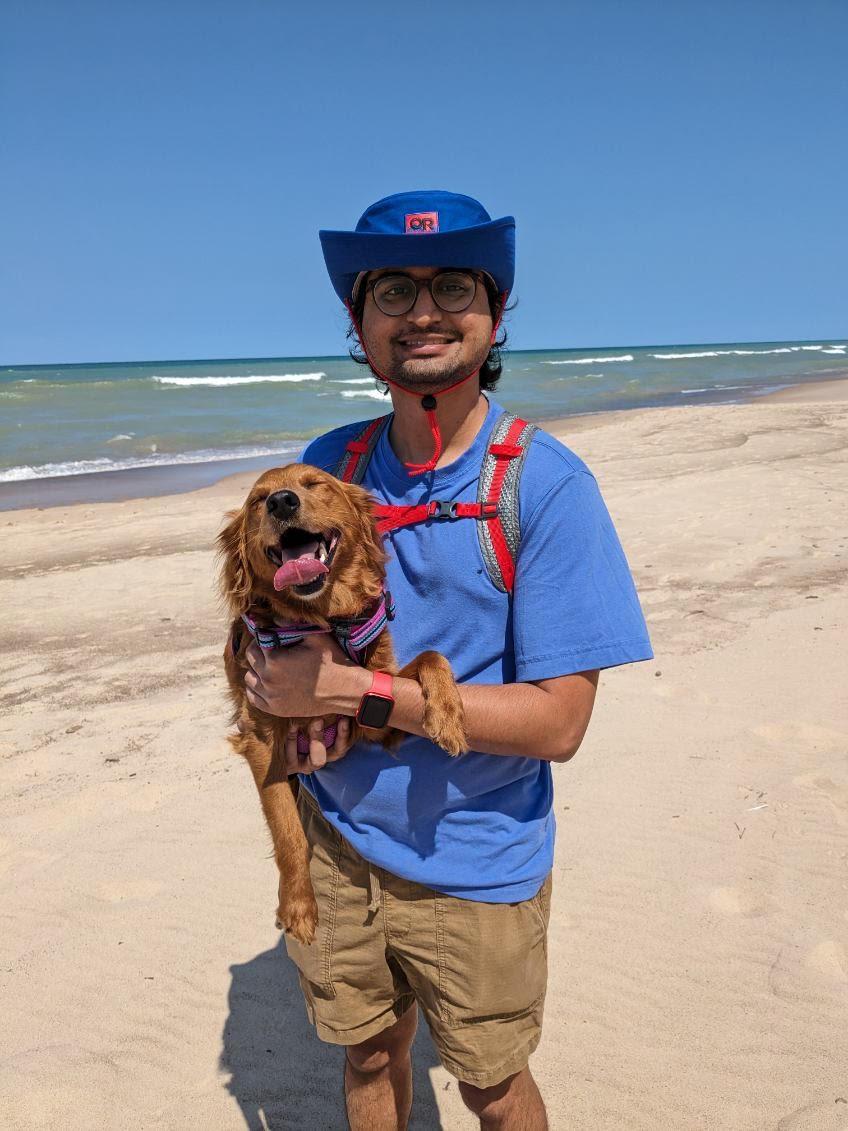
R Consortium recently talked to Sam Parmar of the Indy UseR group about using R in public health and pharma in Indianapolis. Sam also spoke about his volunteer work with the R Weekly newsletter. The newsletter aims to provide subscribers with a comprehensive list of the latest R resources from around the web. Sam also discussed his short online book with tips and tricks for using AI assistant tools such as ChatGPT or GitHub Copilot.
Please share about your background and involvement with the RUGS group.
I am a Statistical Data Scientist at Pfizer and a member of the RCoE SWAT team, which stands for Scientific Workflows and Analytical Tools. We consult with other Pfizer business lines to provide technical expertise on using the R programming language and its various packages. We are also building a community around using R, which has over 1000 members at Pfizer.
From 2017 to 2020, as an epidemiologist for a local health department, I came across R, which we used in conjunction with SAS. This is how I first got involved with the R community. I used to read the R Weekly newsletters and started participating in the Indy UseR group, which Shankar Vaidyaraman and Derrick Kearney organized. It helped me discover many new tools and grow my network. I used R for a few years as an epidemiologist before working in the Pharma sector.
In my experience with the IndyUseR group, the R community is very welcoming. R has excellent documentation, including Quarto books and R Markdown, which makes learning the language easier. I love that many people are willing to create excellent free resources and present their work. We’ve been lucky to have the creators of the gt and targets packages present at our previous user group meetings. I wouldn’t have been able to change careers without this welcoming community successfully.
Can you share what the R community is like in Indianapolis?
The community is diverse, with folks from many backgrounds, such as pharma, public health, and academia. Seeing new faces in our user group meetings this year has been great. Many recent graduates and students attending our meetings are familiar with the tidyverse. At a meeting earlier this year, we connected with a professor teaching analytics at a local university. We enjoyed learning his perspective on educating students in R.
Please share about a project you are currently working on or have worked on in the past using the R language. Goal/reason, result, anything interesting, especially related to the industry you work in?
As I stated previously, I was an avid reader of the R Weekly newsletter. I joined the curation team that generates these issues online just over a year ago. We have an engaged community of readers and listeners and a podcast accompanying the newsletter.
R Weekly logo
R Weekly is an open source project launched in 2016 and is still actively maintained today. This achievement is remarkable, as very few open source projects last and are actively maintained for a long time. A volunteer curation team oversees the publication of R Weekly. We aggregate information from various RSS feeds, as well as contributions via pull requests made directly to the GitHub repository we host. Our content is public, so it is possible to view historical issues and suggestions we have integrated into the platform.
It is an amazing resource, and we are looking for more members on our team. So, if anyone reading this interview is interested, please submit resource links or do a few pull requests and join our team. Fill in this form to join our team.
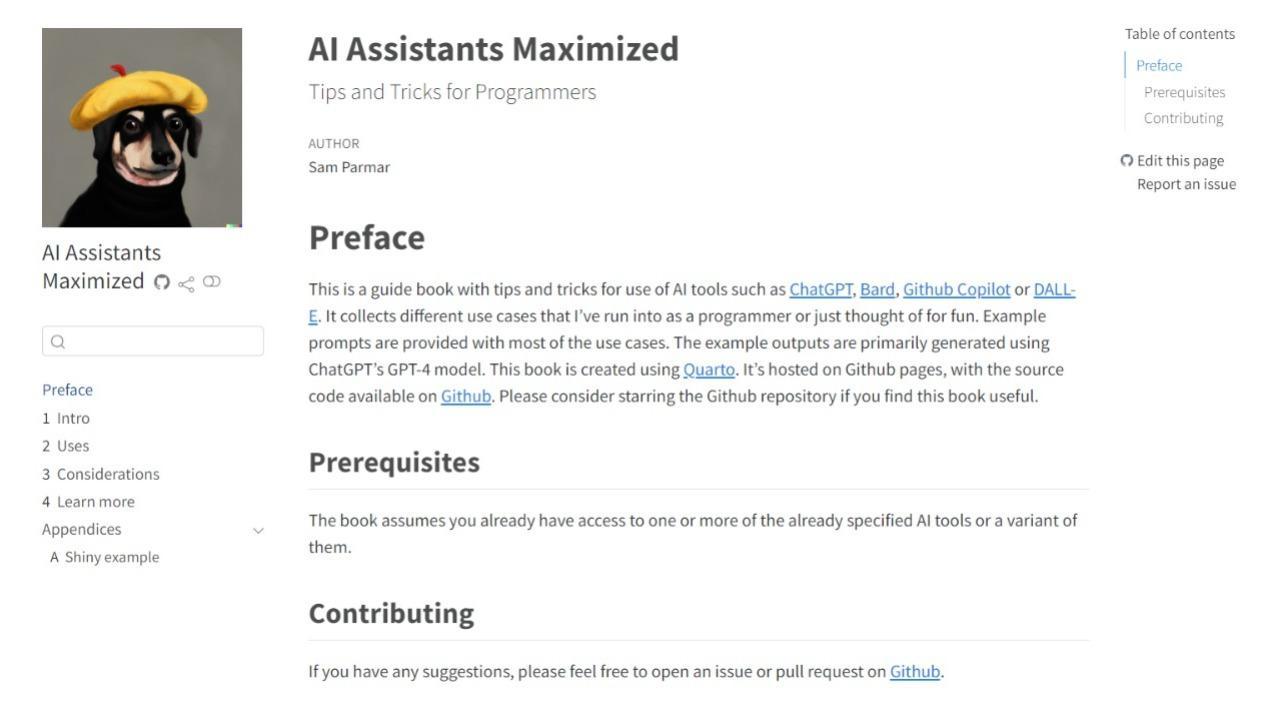
Another thing I’m working on is a short tips and tricks book on using AI assistant tools for programmers. This book aims to guide anyone interested in integrating tools like ChatGPT or GitHub Copilot into their workflow and setting up guidelines. It’s not perfect, but I wanted to share it with the community to generate interest and get support from anyone interested in contributing to the book.
What trends do you currently see in R language and your industry? Any trends you see developing in the near future?
There is a lot of interest in Shinylive for R and Python in the pharma space. The developments in WebR technology are truly amazing. I’m involved in a Submissions Working Group Pilot that is looking into the use of WebR and Shinylive for regulatory submissions. Hopefully, in the future, we’ll see it being used for submissions. Additionally, the integration of GitHub Copilot in the RStudio IDE is an exciting new release that I think many people are looking forward to.
How do I Join?
R Consortium’s R User Group and Small Conference Support Program (RUGS) provides grants to help R groups worldwide organize, share information, and support each other. We have given grants over the past four years, encompassing over 65,000 members in 35 countries. We would like to include you! Cash grants and meetup.com accounts are awarded based on the intended use of the funds and the amount of money available to distribute.
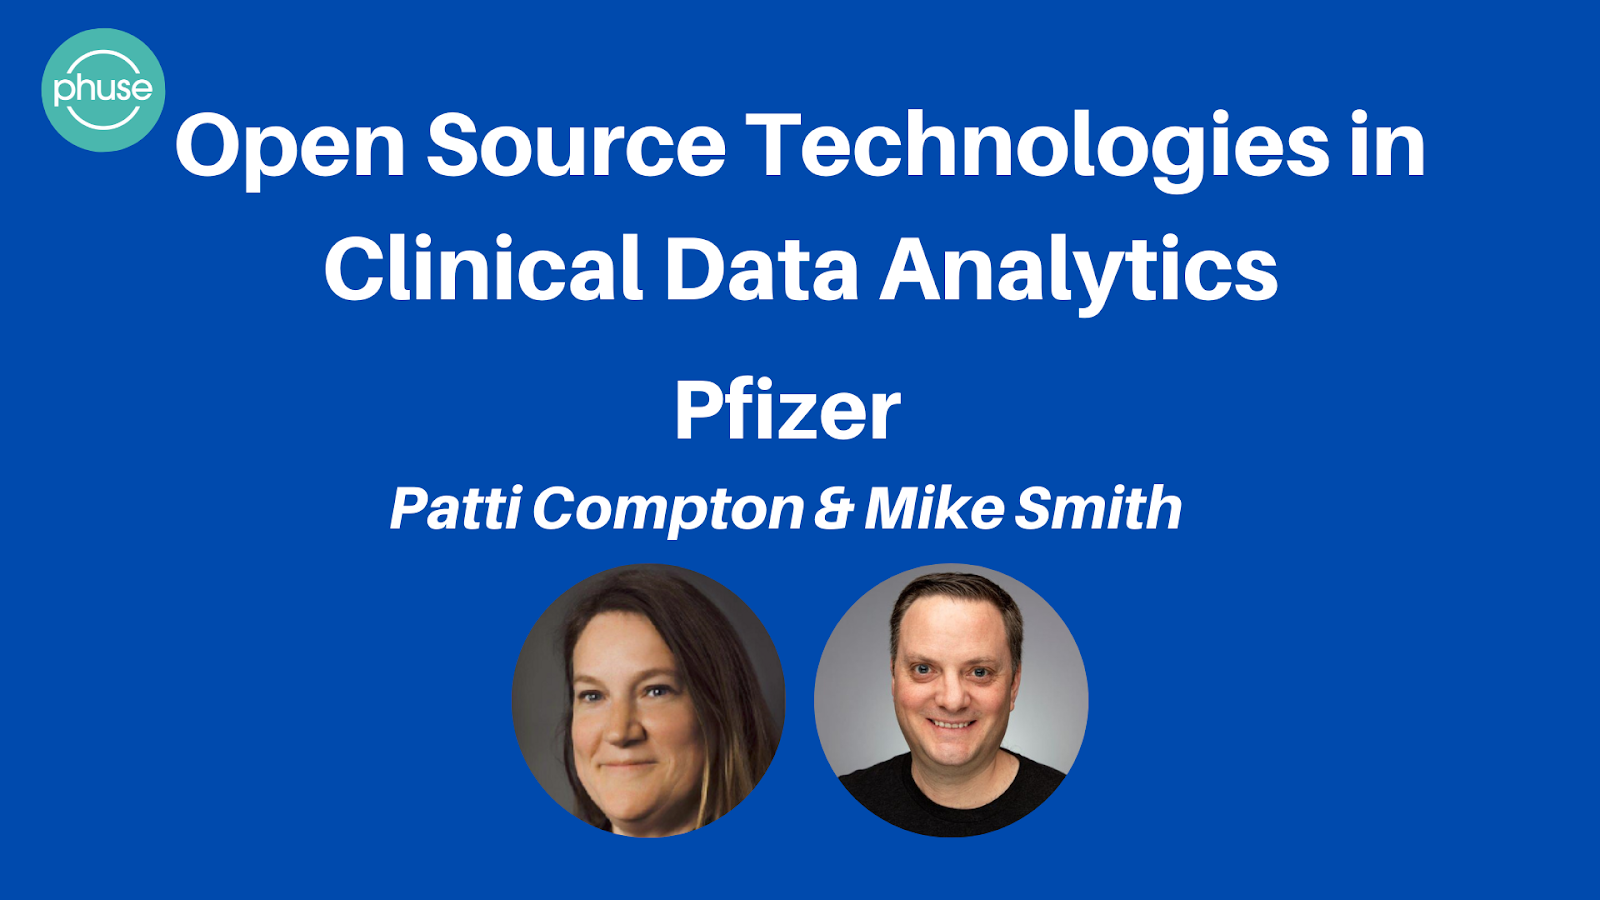
In this PHUSE video interview, Pfizer is making strides in incorporating open source tools into its clinical reporting processes. Michael Rimler, PHUSE Open Source Technologies Director, brings in Mike Smith, Senior Director at Pfizer, head of its R Center of Excellence, and R Consortium board member, and Patti Compton, Vice President and head of Statistical Data Science and Analytics at Pfizer, to discuss Pfizer’s open source journey.
While Pfizer has used R for many years, primarily in clinical pharmacology and QA metrics, the company is now looking to transition more of its clinical trial reporting to be predominantly R based within the software development lifecycle. Smith notes some challenges of “changing the wheels on the bus while it’s rolling down the highway,” but both leaders emphasize the importance and benefits of collaboration through open source.
Patti Compton sees opportunities to build Pfizer’s data science community, leverage the rich library ecosystem, and gain platform independence to take time out of drug development timelines. Both envision a future where submissions to regulators use interactive data tools to allow deeper exploration of clinical trial results.
Smith predicts more interactive platforms between industry and regulators for activities like label negotiations within the next two to three years. Compton agrees that open source will be applied in new ways across drug discovery and development and expects expectations for data science skills to increase. The interview provides insight into Pfizer’s motivations and goals for advancing open source adoption within clinical reporting and analytics.
The R Consortium recently had the opportunity to talk to Isidro Hidalgo Arellano and Gema Fernández-Avilés Calderón of the R Quixote user group in Spain. They discussed the R for Business, Teaching, and Research Conference (R4EDI) organized by the group annually. The conference acts as a bridge between students, researchers, and industry in Castilla-La Mancha. Each year, the group invites prominent data scientists from all over Spain to speak at the conference.
The group is also writing a book titled Fundamentals of Data Science with R in Spanish. The book is being written by experts from a diverse range of backgrounds to provide a comprehensive learning resource for Spanish R users.
Isidro Hidalgo Arellano, Head of Section at the Obs. of the Labor Market Castilla-La Mancha Community BoardGema Fernández-Avilés Calderón, Full Professor, Director of Masters in Data Science and Business Analytics program University of Castilla La-Mancha
Please tell us a little bit about your R User Group.
Gema: We are a relatively new R User Group, and our name is R Quixote. We started in February 2021 with eight group members, and we now have more than 50 members. Our original scope was our region, Castilla-La Mancha, but currently, we have members from different parts of Spain, like Madrid and Murcia. We also have members from other countries like Argentina and Colombia. The majority of our members are from the University of Castilla-La Mancha. We also have members from different universities like the University of Alcala, the Complutense University of Madrid, and the National Distance Education University, and private and public companies like the Government of Castilla-La Mancha, and CEOs of private companies like Analitycae, Okuant, or MRC Consultants.
We also have strong collaborative ties with R user groups across the region. We collaborate with Emilio López Cano, the president of R-Hispano, the R National group. We have also organized events with Aurora González Vidal, the president of UMUR.
Our user group collaborates with the University of Castilla-La Mancha in the Master of Data Science & Business Analytics (with R software). The program is completely online and taught in R. The agreement between R Quixote and UCLM allows a 10% discount on the tuition fee to the R Quixote members.
Isidro: I have designed the group logo, and it features the helmet of Mambrino, which is really famous here in the Quixote region. The lead character of the novel Don Quixote by Miguel de Cervantes inspires it. It also features a silhouette of a windmill, again a reference to the novel. I have improvised a little and used an electric windmill instead of a traditional windmill. We have a webpage, but some sections are under construction. We are also on Twitter, but we are not very active there.
You held the 3rd R4EDI Conference from 19-20th October 2023. Can you share the details?
Gema: We host an annual event called the R4EDI Conference (R para Empresa, Docencia e Investigación; R for Business, Teaching, and Research). Our first conference was in Toledo in June of 2021. Toledo is a very beautiful city in Castilla-La Mancha. It was a Hybrid event because of the pandemic. At this event, we had three important guest speakers: Emilio López Cano, President of R-Hispano (the most important R local group of Spain), Aurora González Vidal (President of UMUR, the R local group of the region of Murcia), and Xavi de Blas (Senior Software Developer at Chronojump).
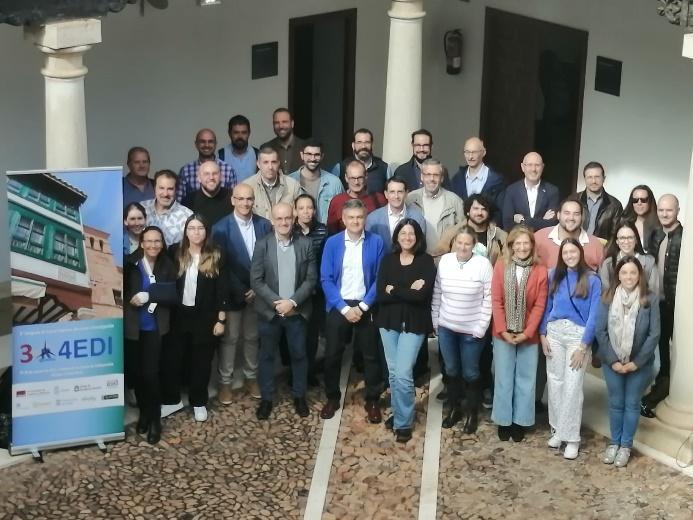
We began hosting this conference as a physical event, and it is a great place to meet people from business, teaching, research, and government to share ideas. This year, we organized the event in Almagro from 19-20th October 2023. Almagro is a beautiful city from Ciudad Real. We invited speakers like Mari Luz Congosto. She is a very prominent engineer from Telefonica; she’s currently teaching at the University Carlos III of Madrid. Borja Andrino from El País newspaper also spoke at the event. María Jiménez, a senior researcher from La Paz-IdiPAZ, also gave a talk. La-IdiPAZ is a national hospital located in Madrid. Here is a photo of the group:
3rd R4EDI Conference, Almagro
The 3rd R4EDI was our main event, and we were delighted to provide a networking platform to businesses, students, and researchers. This year, Julián Garde, the rector of the University of Castilla-La Mancha, inaugurated the conference.
Any techniques you recommend using for planning for or during the event?
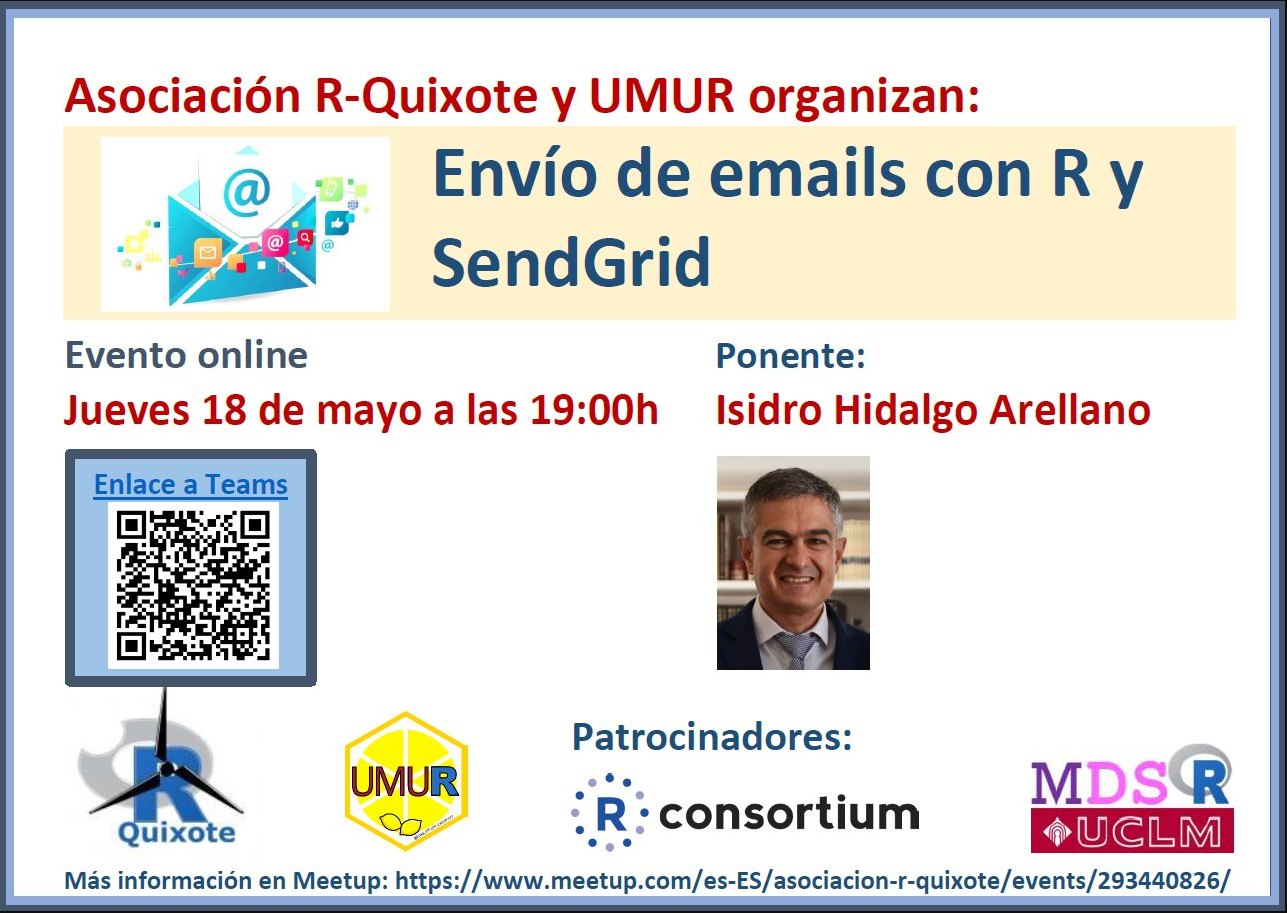
“Sending Emails with SendGrid R Package” Event, May 2023
Isidro: I want to discuss an interesting package that can be really helpful for RUG organizers. I also gave a workshop on the use of the SendGrid R package. It allows you to create prototypes of certificates, for example, certificates of participation or certificates for conference organizers. It is really useful because we now have the code for these events, and you can send all the conference certificates in no time. This package can be very useful for RUG organizers.
Please share about a project you are currently working on or have worked on in the past using the R language. Goal/reason, result, anything interesting?
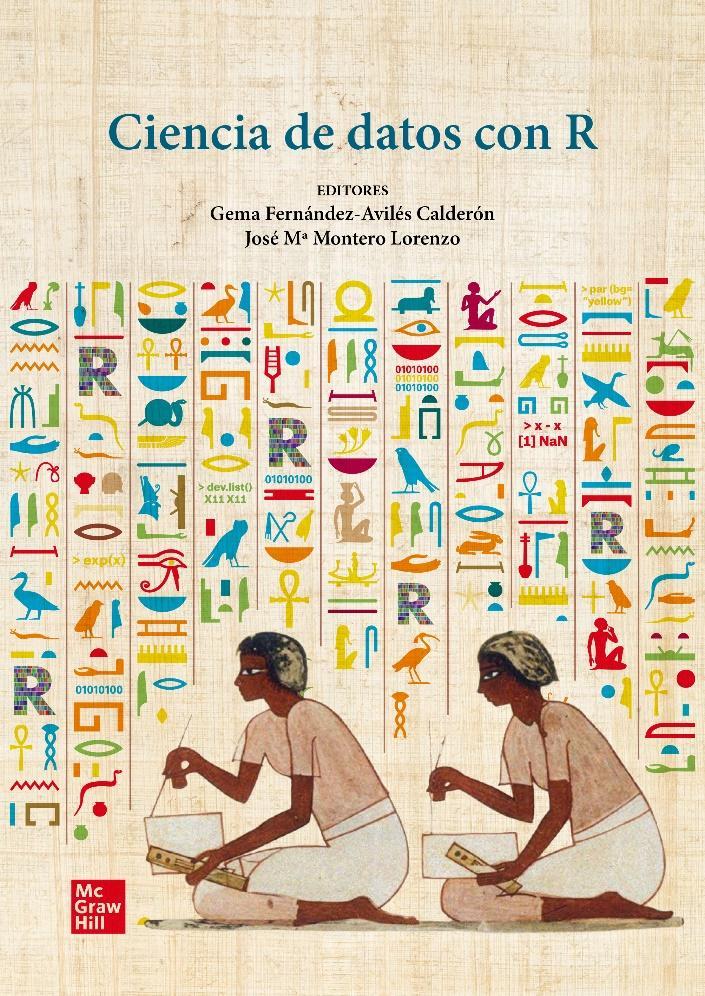
“Fundamentals of Data Science with R” Book Cover
Gema: We are working together on writing a book for the Hispanic R community. Almost 50 people are working on this book, most of them researchers. The title of the book is Fundamentos de Ciencia de Datos con R (Fundamentals of Data Science with R). The main motivation behind writing this book was that Spanish is among the most spoken languages in the world. Yet, there are not many good and comprehensive data science books written in Spanish. We wanted to write a really good book in Spanish with statistics fundamentals, not only with machine learning but also deep learning and text mining. We also have a section dedicated to special data science and a very important part of communication with Quarto and R Markdown. We also have 13 case studies from different areas like soccer, health, marketing, unemployment, finance, and retail.
CDR Package Logo
McGraw Hill will publish this book, and we will have an open webpage. We also have our own R package CDR, with all datasets used in the book that are not free on other websites. Isidro has also designed the logo for the package. We are very proud to announce that Julia Silge will be writing the prologue for the book.
Join PHUSE in Birmingham, UK, from November 5-8 for an event that promises to energise your learning through connection with the PHUSE Community and hearing from our experts on the topics that are most important to industry today.
The R Consortium is participating directly in one session on Tuesday, November 11, starting at 11am local time. Dive deep into the world of open source in pharma by joining a panel discussion that includes Mehar Pratap Singh, Chairman of the Board of Directors at the R Consortium, Director Sumesh Kalappurakal, and other open source representatives entitled “Let’s Discuss Open Source Openly: A New Path in Pharma.” This is an excellent opportunity to engage in a meaningful discussion and gain insights from leading voices in the industry.
One of the highlights of this event will be “Let’s Discuss Open Source Openly, A New Path in Pharma,” a session led by Director Sumesh Kalappurakal, Mehar Pratap Singh, Chairman of the Board of Directors at the R Consortium, and other open source representatives. Dive deep into the world of open source in pharma, understanding its implications and the potential it holds for the future. This is a golden opportunity to engage in meaningful discussions and gain insights from a leading voice in the industry.
It’s not too late to register your place or secure a sponsorship opportunity! View full information via the links below and explore the agenda to see what’s in store for attendees.