Mouna earned the Opportunity Scholarship for the Posit 2023 Conference and thoroughly enjoyed the amazing experience.
The R Consortium recently interviewed Mouna Belaid, a co-organizer of R-Ladies Paris, who provided insights into the growth of the R community in Paris, especially in the French language. Dedicated channels are available for French speakers to seek assistance and other resources.
Please share about your background and your involvement in the R Community. What is your level of experience with the R language?
Mouna met and received the ‘R for Data Science – 2nd edition’ book offered by Posit, signed by both Hadley Wickham and Mine Çetinkaya-Rundel, two of the book’s co-authors, during the book reception at the Posit 2023 Conference in Chicago.
My name is Mouna, and I’m originally from Tunisia, a country in North Africa. Currently, I’m based in Paris, France. Professionally, I’m an engineer with a degree in statistics and data analysis from the Tunisian Higher School of Statistics and Data Analysis. Additionally, I hold double research master’s degrees from the School of Engineers of Tunis and Université Paris Cité, where I completed my academic journey in Tunisia. This is also where I began my career as a data scientist in the banking sector before moving to Paris. Now, I work as a data consultant at ArData, a French consulting company specializing in data science.
I’m particularly skilled in analytic tools like R, Python, SQL, Alteryx, and Power BI. Recently, I’ve been focusing on R in my current job, developing Shiny applications and working on data visualization projects. My journey with R began during my engineering studies in Tunisia, where it was a core part of our curriculum.
Beyond my professional work, I’m deeply involved in the R community. I’m a co-organizer of the R-Ladies Paris Community and a co-founder of the R Ladies initiative in Tunisia. Upon moving to France, I reactivated the R-Ladies Paris chapter. I’m also a part of the R-Ladies global team, responsible for onboarding new chapters, and a certified Carpentries instructor. I had the pleasure of being a member of the Program Committee at the Shiny 2023 conference organized by Appsilon.
I’m always eager to learn more and contribute to the R and data science fields, and I’m excited about my ongoing journey and experiences in these areas.
We would like to get to know you more on the personal side. Can you please tell me about yourself? For example, hobbies/interests or anything you want to share about yourself.
I’m really active and enjoy being on social media, particularly LinkedIn. I dedicate significant time to sharing updates on new achievements and staying connected with our community. I’m also very interested in exploring analytical tools on LinkedIn, like tracking key indicators and the performance of my posts. If I weren’t a data consultant, I would be thrilled to work as a community manager, managing social media platforms.
Couscous, a traditional Tunisian dish
In addition to my professional interests, I have a passion for cooking, especially traditional Tunisian dishes like couscous. I really love engaging in this culinary art. That pretty much sums it up!
What industry are you currently in? How do you use R in your work?
I work in the public sector, specifically at the Ministry of Health in France. I am in the Directorate of Research, Studies, Evaluation, and Statistics. My main responsibility involves migrating code scripts from SAS to open-source tools like R and Python. This is a significant initiative we are undertaking right now. As part of my role, I oversee the technical aspects, including understanding the scripts and collaborating with the business teams and the script developers. My goal is to effectively migrate these scripts into R, primarily using the tidyverse package. In addition, I provide professional training sessions about R. These tasks form the core of my current responsibilities.
Why do industry professionals come to your user group? What is the benefit of attending?
Mouna presented the R-Ladies Paris community at the “Rencontres R” local conference dedicated to R users, held in Avignon, France, in June 2023.
In my experience with R-Ladies Paris, I believe we’re doing our best to create a safe and inclusive space for everyone. We organize not just in-person meetups but also online ones to enhance accessibility. To ensure everyone can benefit, we record these presentations and workshops and then share them on our YouTube channel. Our topics cover a wide range, suitable for various skill levels, from beginners to experts. These include data visualization, presentations, interdisciplinary work, and even how to develop an R package.
We also collaborate with other sectors, including those focused on Python programming, making our meetups relevant for a diverse audience. Beyond the technical aspects, we host social events; for instance, last October, we had a wonderful gathering in a bar in Paris. Additionally, we maintain a dedicated page on GitHub where summaries and recordings of all our meetups are available. That sums up my involvement and our initiatives at R-Ladies Paris.
What trends do you currently see in R language and your industry? Any trends you see developing in the near future?
I believe that the data science landscape has been significantly elevated, particularly through the capabilities of working with the tidyverse framework. The announcement of ‘quarto‘ and the wonderful projects developed using it has been revolutionary, enhancing our projects’ recommendation and reproducibility aspects. I’d like to talk about the use of R in France specifically. The community here has been evolving continuously.
INSEE, the National Institute of Statistics and Economic Studies in France, has been crucial in promoting open-source tools. This is evident in their GitHub repositories, where they advocate strongly for the use of R and Python. Several public and academic institutions in France have also adopted R. There’s a dedicated Slack space for R users in France. This space is primarily for discussions in French, where individuals can discuss R-related news, seek assistance, and ask questions. It’s a vibrant community where people actively participate and provide answers. That summarizes my perspective on the evolution and impact of data science tools, especially R, in France.
How do I Join?
R Consortium’s R User Group and Small Conference Support Program (RUGS) provides grants to help R groups organize, share information, and support each other worldwide. We have given grants over the past four years, encompassing over 65,000 members in 35 countries. We would like to include you! Cash grants and meetup.com accounts are awarded based on the intended use of the funds and the amount of money available to distribute.
Guest blog contributed by Rikimaru Nishimura, Statistical Programming, Janssen Pharmaceutical K.K.
I would like to introduce the task force of Open-Source Software (OSS) in Data Science Expert Committee, Drug Evaluation Committee of Japan Pharmaceutical Manufacturers Association (JPMA), which is one of the R activities in Japan.
This task force has started its activities since 2022 and currently consists of 10 members from pharmaceutical companies. The purpose of this task force is to investigate the use of OSS which is being more actively used in the pharmaceutical industry, especially for the analysis of clinical trial data and work related to regulatory submission, and to compile and publish a report on the expected benefits and issues when OSS is used.
The document titled “Utilization and Considerations for Open-Source Software” was released by JPMA last year. In the document, current activities related to R in the pharmaceutical industry, the challenges of using R for regulatory submission, package versions and operation managements, and examples of R training are introduced.
In addition, a survey report on the actual use of R in pharmaceutical companies has also been released. Survey results show that more than half of pharmaceutical companies in Japan are already using R and half of the companies have already submitted documents generated by R to regulatory authorities. On the other hand, the task force found that many companies have concerns about using R, such as reliability of open-sourced packages.
There are also challenges in using R for submission. PMDA does not require the use of specific software for the data management and analysis of clinical trial data for the purpose of the submission. Therefore, the choice of software to be used is left to the applicant, and there is no problem in using R for the purpose of submission. However, it is necessary for the applicant to conduct verification work to ensure the quality of the software (reliability of analysis results) and document the procedures and results.
The main theme of this year’s task force is to collect and publish examples of R and Python utilization in the pharmaceutical companies in Japan. The task force is planning to investigate examples of OSS utilization in clinical development and share the introduction procedures, usage environment, software including packages, and utilization effects. The task force will also continue to consider the use of R for submission same as last year.
Finally, I believe that the use of R will become even more active in the pharmaceutical industry in Japan. I will continue to work closely and actively with the R consortium and other external organizations to contribute to the increased use of R throughout the pharmaceutical industry.
About the Author
Rikimaru Nishimura has worked as a Statistical Programmer for Janssen Pharmaceutical K.K. since February 2015. He is responsible for statistical analysis in clinical trials and e-Data submission to PMDA. Before working in the pharmaceutical industry, he has experience developing bank accounting and customer management systems in Japanese technology company. Also, he is a start-up member of the open-source software task force in Japan Pharmaceutical Manufacturers Association.
The actuarial profession is on the cusp of a transformation spearheaded by integrating programming into the traditional spreadsheet-based workflow. Georgios Bakoloukas, Head Model and Analytics, Swiss Re and Benedikt Schamberger, Head Atelier Technology & AI Consulting, Swiss Re, are at the forefront of this paradigm shift.
This blog encapsulates 4 upcoming webinars showcasing the journey from Excel to high-performance programming in R. The webinars are scheduled to be broadcast in January 2024, and you can participate directly. Beginners are welcome.
Webinars by Georgios Bakoloukas:
From Excel to Programming in R
Date: January 10th, 2023
Duration: 30 minutes
Georgios will introduce a compelling case for why actuaries should embrace R programming while continuing to use Excel. The session promises to demystify the transition, using insurance industry examples, to demonstrate the benefits of adopting a programming mindset alongside familiar spreadsheet computing.
Putting R into Production
Date: January 17th, 2023
Duration: 30 minutes
The follow-up webinar takes the discussion from solving problems in R to sharing these solutions. Georgios will cover documentation, testing, and dissemination using R’s packaging, Web API creation, and GUI generation through Shiny. This practical approach ensures that coding efforts are not siloed but add value across the organization.
Webinars by Benedikt Schamberger:
R Performance Culture
Date: January 24th, 2023
Duration: 30 minutes
Benedikt will address the nuances of optimizing code performance in R. Acknowledging that premature optimization might be detrimental, he will provide insights into when and how to refine code. The session includes a look at R’s design philosophy regarding performance and the tools available for tuning.
High-Performance Programming in R
Date: January 31st, 2023
Duration: 30 minutes
Continuing the performance theme, Benedikt will delve into the limitations of CSV files and introduce binary formats that bolster efficiency. He will explore the arrow R package and the Parquet file format, demonstrating their potential to reduce time and disk space requirements significantly.
Conclusion:
These webinars offer a roadmap for actuarial professionals keen on enhancing their toolkit with programming capabilities. As the industry evolves, the skills taught by Georgios and Benedikt will become increasingly indispensable, marking a step towards a more innovative and efficient actuarial future.
Please join us to learn more about actuarial science here.
The use of the R programming language has seen exponential growth across industries, with its role being especially pronounced in the pharmaceutical sector. Japan stands out in this growth narrative, thanks in part to the initiatives of the Japan Pharmaceutical Manufacturers Association (JPMA). Before diving into the webinar insights, understanding JPMA’s profound influence and contributions is essential.
About JPMA
Established in 1968, JPMA is a voluntary consortium of 71 research-centric pharmaceutical firms. With its core mission of “realizing patient-oriented healthcare,” JPMA has tirelessly worked towards enhancing global healthcare through the formulation of pioneering ethical drugs.
Summary of the Webinar’s Concept
The Adoption of R in Japan’s Pharma Industry talk and panel discussion will be led by key industry experts from the JPMA R Task Force Team. The webinar explores the usage and adoption of the R in the pharmaceutical industry, specifically focusing on the findings of the JPMA Drug Evaluation Committee, R Task Force Team, and the JPMA Report. The report references various open source works and publications, including those from the R Consortium pilot submissions, Package Validation Hub, and webinar training.
Agenda of the Webinar:
General Background (10-15 minutes)
PMDA: Highlighting the intricacies of submissions with R.
JPMA R Task Force: Delving into past activities and shedding light on future initiatives.
JPMA Survey Report (15-20 minutes)
Background: Understanding the rationale and motivation behind the JPMA survey.
Results: Discuss key findings and their implications for the industry.
Q&A Session (15 minutes)
Date and Time: Tues, Jan 9, 2024 at 9:00 am JST / Jan 8, 2024 at 4:00 pm PT / 7:00 pm ET
Conclusion:
Under the auspices of JPMA’s guiding principles, the webinar will present a comprehensive glimpse into R’s evolving role in Japan’s pharmaceutical landscape. The dedication of JPMA, combined with the increasing relevance of R, signifies an exciting chapter in the pharmaceutical domain’s data-driven journey.
Join the JPMA webinar to learn more about R’s pharmaceutical achievements!
Laura M. Sangalli is a professor of Statistics at Politecnico di Milano, Italy. Her research interests include functional data analysis, high-dimensional and complex data, spatial data analysis, and biostatistics. With a team composed by Aldo Clemente, Alessandro Palummo and Luca Formaggia at Politecnico di Milano, and Eleonora Arnone at the University of Turin, Laura created the femR, a package for applying Finite Element Methods to solve second-order linear elliptic Partial Differential Equations over two-dimensional spaces. A grant from the R Consortium supported this project.
“femR: Finite Element Method for Solving PDEs in R” was funded by the R Consortium in 2022. What is the current status?
The femR project, generously supported last year by the R Consortium, aimed to develop a package implementing Finite Element Methods (FEM) for solving simple yet flexible forms of Partial Differential Equations (PDEs), specifically second-order linear elliptic PDEs across general two-dimensional spatial domains. This goal has been successfully achieved, and the project is now complete. However, development on the femR package continues, extending beyond the original proposal funded by the R Consortium.
The femR package is accessible in its GitHub repository at https://github.com/fdaPDE/femR. It includes documentation and initial vignettes. Key functionalities of femR, as outlined in the proposal, are:
Providing an interface with the RTriangle package, enabling users to build two-dimensional triangular meshes from the boundaries of spatial domains.
Constructing finite element bases over these triangulations.
Solving elliptic PDEs using finite element discretization.
The project’s broader objective was to introduce the R community to a foundational tool for applying Finite Element Methods to certain PDE problems. This is especially relevant considering the R community’s prevalent use of the deSolve package, which employs finite differences for discretization in differential problems.
During the development of femR, the team engaged with Karline Soetaert and Thomas Petzoldt, the authors of deSolve. These interactions led to the realization that the deSolve community had a keen interest in space-time PDE problems—a domain femR had not initially planned to address in its original proposal. Responding to this need, the team began developing capabilities within femR for solving time-dependent PDE problems, expanding the package’s scope and utility beyond its original mandate.
In summary, the femR project has not only achieved its primary goal of providing a tool for solving specific types of PDEs using FEM in the R environment but has also adapted and grown in response to community feedback and evolving scientific needs, particularly in the realm of space-time PDE problems.
What is your background, and why did you decide to propose this project?
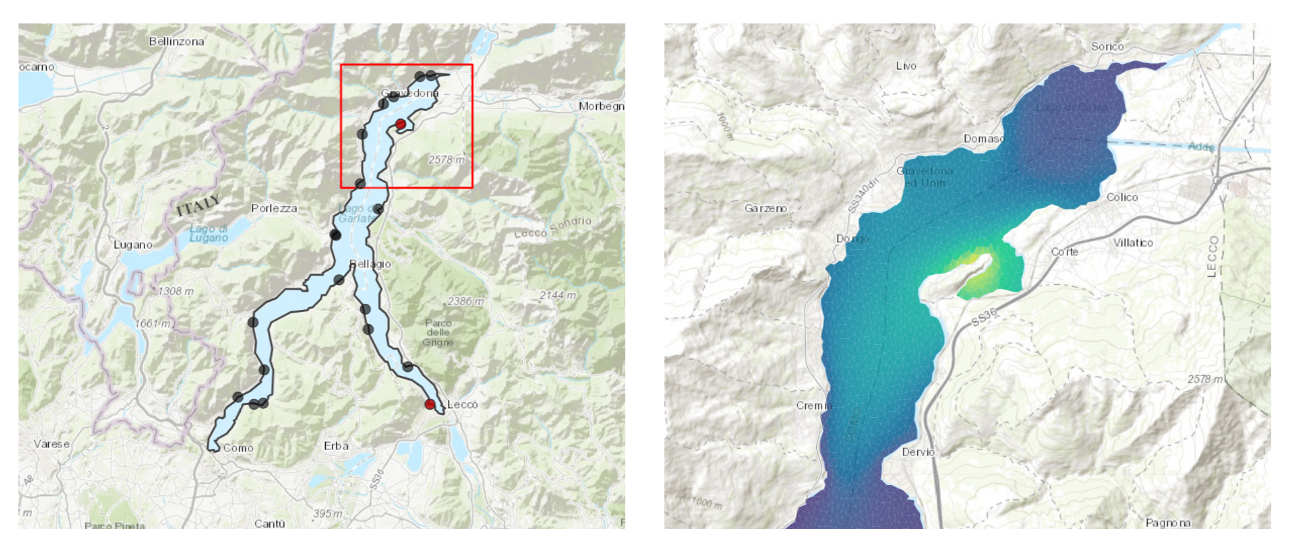
Simulation of diffusion of a substance of interest in Lake Como. On the left, a map of Lake Como, with black and red markers denoting the locations of monitoring stations. The red markers indicate potential hotspots, where high concentrations of the substance of interest have been recorded. On the right, zoomed-in view of the concentration of substance of interest, on the Northern portion of the lake, computed with femR. This simulation is carried out solely for illustrative purposes.
My main research interest lies in developing Physics-Informed statistical models for spatial and functional data observed over complex multidimensional domains, such as the brain’s surface, the gray matter’s volume, a spatial region with a complex conformation, or a road network. In regularizing terms, these Physics-Informed statistical models use PDEs to embed knowledge of the Physics of the underlying phenomenon and the geometry of the domain into the statistical models.
I love these methods since they bind together two of the richest and most powerful modeling frameworks, from statistics and mathematics. On the one hand, the regression/maximum likelihood framework for the empirical model, and on the other hand, PDEs are the most powerful mathematical tool to model complex phenomena and behaviors.
The Physics-Informed statistical models we develop leverage on Finite Elements discretizations of the estimation problems, and they are implemented in the R package fdaPDE, which is available from CRAN for almost ten years now. This package fills a significant gap in R’s capabilities, as there was a notable absence of direct implementations of FE methods for solving PDEs, as also highlighted in the CRAN Task View on Differential Equations.
As we already discussed, deSolve enables solving some simple forms of PDEs through finite differences. However, finite differences work over regular tensorized domains (rectangular domains) and are not the natural choice to solve PDEs on more complex domains. Moreover, they cannot achieve the same level of accuracy of FEM.
Therefore, the need for an R package capable of solving PDEs using the FEM to complement deSolve. The development of femR addresses this need. It provides solutions for PDEs on complex domains and enhances accuracy, aligning perfectly with my research interests in advancing sophisticated, Physics-Informed statistical models.
Finite Element Methods (FEM) are used to solve partial differential equations (PDEs). In what situations is it used most often? Can you give some basic examples of when you would use R and FEM to solve a PDE?
Partial Differential Equations (PDEs) are extensively used in all sciences and engineering fields to model complex phenomena behaviors. However, PDEs do not usually possess closed form solutions and are typically solved numerically through discretization methods.
The Finite Element Method stands out as one of the most popular, computationally efficient,
and versatile approaches for discretizing and solving PDEs. (Editor’s note: In applied mathematics, discretization is the process of transferring continuous functions, models, variables, and equations into discrete counterparts.) This method enables the solution of PDEs on multidimensional domains with complex shapes and various boundary conditions with high accuracy.
The femR package I’ve been discussing exemplifies the application of FEM in addressing a range of partial differential problems. It can handle both spatial and spatiotemporal diffusion-transport-reaction problems. A common and straightforward example is heat conduction, modeled by the well-known heat equation. This capability finds numerous applications in various fields.
In environmental sciences, for instance, femR can be utilized to study the dispersion of pollutants released in water or air, which are transported by currents or winds. It is also adept at modeling temperature variations and pressure. In biomedicine, femR could be used to study electrophysiology and the mechanics of organs, including tumor growth dynamics.
These examples demonstrate the wide-ranging applicability of femR in solving complex PDEs across diverse scientific disciplines. The package’s ability to handle simple forms of elliptic and parabolic PDEs and more complex PDE scenarios makes it a valuable tool in the scientific community. Moving forward, there are plans to continually enhance femR, expanding its scope to address increasingly complex differential problems and applying it to additional fields of study.
Since FEM implementations were not available in R in the past, statisticians had to use external software. Now you can do this using R. Can you explain what the before and after looks like for a statistician who is using R? How big of a change is it?
Including PDEs in data analysis methods allows us to incorporate problem-specific information that may come from the problems in physics, chemistry, mechanics, or morphology of the problem into the statistical model. These physics-informed methods are gaining increasing attention from the scientific community. For example, Physics-informed Neural Networks represent a cutting-edge research direction in Artificial Intelligence.
PDEs are not only pivotal in advanced fields like AI but are also fundamental components of epidemiological models. Additionally, they are being increasingly used in spatial data analysis and functional data analysis. These applications are particularly useful for modeling data observed over complex domains and addressing issues like anisotropy and non-stationarity.
As the complexity of data analysis challenges our community faces grows, there is an escalating need for new data analytics methods that effectively combine empirical and physical models. It’s becoming increasingly important for statisticians to be familiar with PDEs as a fundamental tool for modeling complex phenomena.
In this evolving landscape, the femR package plays a crucial role. It offers a built-in toolbox within the R environment for solving PDEs using Finite Element Methods (FEM), thus eliminating the need for users to depend on external environments. We have invested significant effort in creating an intuitive R interface. This interface simplifies formulating differential problems, making it as easy as writing them down on paper. We are confident that the availability of femR, a native and user-friendly package, will greatly aid and assist the statistical community in developing new physics-informed models.
We have already prepared documentation and created initial vignettes for our package, available on the GitHub repository at https://fdapde.github.io/femR/. We plan to continue enriching these vignettes with more content.
We aim to offer a tool that may complement deSolve. As mentioned earlier, we have been discussing with the authors of deSolve to understand the needs of the deSolve community. We decided to delay the release of the package on CRAN to enable a testing period in which interested users may start using the package, and we may get feedback. These are crucial as they may help us tailor the package in the most convenient way to the community. This testing period will help us avoid potential backward compatibility issues that we might otherwise encounter and ensure better integration with deSolve.
As I mentioned, we are also actively working on incorporating other functionalities that interest the deSolve community. In particular, as part of the future development of the package, we will aim to introduce non-linear PDE terms, such as logistic terms. Indeed, adding non-linear forcing terms will enable the modeling of various biologically relevant problems, that cannot currently be tackled within femR, perhaps within the next year.
How was it working with the R Consortium? Would you recommend it to other people who work with the R programming language? Will you continue to develop femR?
We’ve had a great experience with the R Consortium, and we would recommend applying for funding to anyone who has the potential to develop packages that can benefit the R community.
Furthermore, the grant enabled us to fund young collaborators, offering them the opportunity to gain research experience and encouraging them to pursue a Ph.D. In particular, through the grant, we supported two graduated students, Aldo Clemente and Alessandro Palummo, co-authors of femR. Aldo and Alessandro are already enrolled in a Ph.D. here at Politecnico di Milano, so we will keep working on femR and enlarge the scope of this new toolbox in several different directions toward more complex PDEs to model phenomena over different domains. We believe this may support the R community in developing new cutting-edge data analysis methods, interfacing statistical methodology and physical models. This will facilitate exploring new avenues of research.
There is a new frontier here in science! Seeds of something big!
About ISC Funded Projects
A major goal of the R Consortium is to strengthen and improve the infrastructure supporting the R Ecosystem. We seek to accomplish this by funding projects that will improve both technical infrastructure and social infrastructure.
Guest blog contributed by Wenlan Pan, Statistical Programmer Analyst, Johnson & Johnson
Transforming the Landscape – The Rise of R in the China Pharmaceutical Industry
In recent years, the China Pharmaceutical Industry has undergone a significant transformation in data analysis practices, driven by the growing interest in utilizing R, a powerful statistical programming language, as an alternative to SAS. This article aims to delve into the significant strides made in R implementation within the industry in 2023, focusing on key meetings, notable examples of R implementation, and panel discussions surrounding the utilization of sharing R-generated reports and the harmonious development of open-source packages.
Key Meetings – Driving R Implementation in 2023
Several influential meetings and discussions in 2023 played a pivotal role in promoting the widespread adoption of R within the China Pharmaceutical Industry. Two meetings were specifically focused on R, while the other two had a broader scope with a growing emphasis on R-related topics. These meetings provided platforms for professionals to exchange knowledge, foster collaboration, and present innovative ideas:
1. The first China Pharma R User Group (RUG) Meeting
It was the first conference of its kind. This groundbreaking event brought together over 300 participants from Shanghai, Beijing, and online on March 31st. With 13 presentations from nine leading companies, the meeting served as a platform for professionals to share knowledge and explore innovative solutions with R for the pharmaceutical industry. It highlighted the growing importance of R in this field and allowed participants to delve into the latest developments, powerful R packages, and breakthrough methodologies that benefit the industry.
2. Open Source Clinical Reporting SummeR 2023 workshop
Hosted by Roche on August 29, this workshop emphasized the importance of open-source solutions and collaboration for clinical data reporting. Through interactive sessions, industry experts shared their experiences using open-sourced R packages like Admiral, NEST, and tidytlg, for tasks such as SDTM mapping, ADaM data creation, and TLG creation. The workshop featured eight presentations, demonstrated the effectiveness of R in generating clinical reports, and provided valuable insights into the successful utilization of open-source R packages for efficient clinical reporting.
3. Pharma Software Users Group (Pharma SUG) 2023 and PHUSE Single Day Events
These two meetings had a boarder focus, each centered around a specific theme. The first meeting focused on “New Policy, New Technology & New Opportunity”, while the second had a theme of “Standardisation-Driven End-to-End Automation”. Coincidentally, these events witnessed a surge in the number of papers and presentations dedicated to R implementation. During these meetings, professionals presented their research and experiences, highlighting how R, when coupled with domain-specific knowledge and standards, contributed to advanced analytics and navigation of complex challenges. It is worth noting that PharmaSUG 2023 also offered pre-conference training on R titled “Deep Dive into Tidyverse, ggplot2, and Shiny with Real Case Applications in Drug Development.” This training provided participants with practical skills for leveraging R’s powerful data visualization and analysis capabilities.
Exemplifying R’s Potential – Notable Examples of R Implementation
R has found wide-ranging applications in the pharmaceutical industry. Here are notable examples:
1. Regulatory Submissions and Reporting
R’s open-code nature enables the development and utilization of open-source projects focused on implementing or developing CDISC standards. In addition to writing R open codes, open-source packages are leveraged. For instance, OAK automates the mapping of CDASH to SDTM and generates raw synthetic data. Admiral, a modularized toolbox, facilitates the development of ADaM datasets in R. R packages like tidytlg make it easier to create tables, listings, and graphs (TLG) for clinical study reports. Notably, several R-based tools have already been officially recognized by the CDISC Open-Source Alliance (COSA) as open-source projects focused on implementing or developing CDISC standards. Another example is Dataset-JSON – R Package Implementation, which allows users to read and write JSON files while also providing functions to update metadata on the dataset. This could help meet the requirements of regulatory submission and other data exchange scenarios. Valuable experience in the development and implementation of such packages in practice had been shared during the meetings.
2. Statistical Analysis and modelling
R could be extensively used for statistical analysis and modeling in clinical trials since it provides a wide range of statistical functions and packages for efficacy and safety analysis. It offers alternative approaches of SAS like mixed-effect models for repeated measures (MMRM) and negative binomial regression, which may require a combination use of multiple packages but also indicate the flexibility of R considering that users can freely choose any packages as they prefer. Furthermore, R allows for the development of custom packages tailored to specific analysis needs, providing specialized functionalities, and enhancing overall data analysis processes.
3. Quality Control and Validation
R offers comprehensive tools and functions for ensuring stringent quality control and validation processes in data analysis and reporting. This is particularly useful during the transition period when validating the outputs produced by SAS using R. R’s built-in validation functions, combined with customized scripts, provide confidence in the accuracy and consistency of results. For example, R allows for the comparison of data frames and reports, offering a fast and efficient way to execute validation checks and generate a summary report, which is user-friendly and flexible.
4. Data Visualization and Interactivity
R’s Shiny package has revolutionized data visualization in the pharmaceutical industry. Going beyond traditional methods, Shiny enables the development of interactive dashboards. This empowers stakeholders to dynamically explore and interpret data, facilitating timely, data-driven decision-making. There are several examples of R shiny apps shared during the meetings, such as those for Prostate-Specific Antigen (PSA) navigation, baseline shiny framework for standard safety tables and figures as well as efficacy modules, and support popPK analysis even for users without known any programming knowledge.
Panel Discussion – Report Sharing and Open-Source Package Development
During the meetings, concerns were also proposed, and panel discussions were conducted with the joined experts from various companies.
Concerns were expressed about the direct use of R for internal and external sharing of reports. Multinational pharmaceuticals and regulators are exploring and attempting to use the new R language written programs to make submissions, marking a shift from submissions that were mainly based on the SAS language in the past. The industry actively engaged in this process and expected the results of pilot studies to evaluate the feasibility and effectiveness of this transition.
Balancing the development of open-source packages and utilizing packages from other companies is another concern within the industry. Organizations are better off adopting an ecosystem-driven approach, evaluating the strengths and weaknesses of different solutions. Active participation in the open-source community empowers organizations to contribute to the development of packages, thereby advancing the industry’s collective knowledge and capabilities.
Embracing a Data-Driven Future in the China Pharmaceutical Industry
The pharmaceutical industry in China is rapidly adopting R for data analysis. Key meetings and discussions have forested collaboration, knowledge-sharing, and innovation. Examples have showcased the vast array of applications, illustrating how R has been implemented in regulatory submissions and reporting, statistical analysis and modeling, quality control, and validation, as well as data visualization and interactivity. Concerns also arise and have been discussed regarding report sharing and the balance between the development and utilization of open-source packages. Embracing R as an essential tool ensures competitiveness and positions organizations at the forefront of scientific progress in the evolving pharmaceutical landscape.
About the Author
Wenlan Pan is a Statistical Programmer Analyst at Johnson & Johnson with over two years of programming experience in the pharmaceutical industry, currently supporting neuroscience studies. She has been using R for seven years and received a Master of Science degree in Biostatistics from the University of California, Los Angeles.
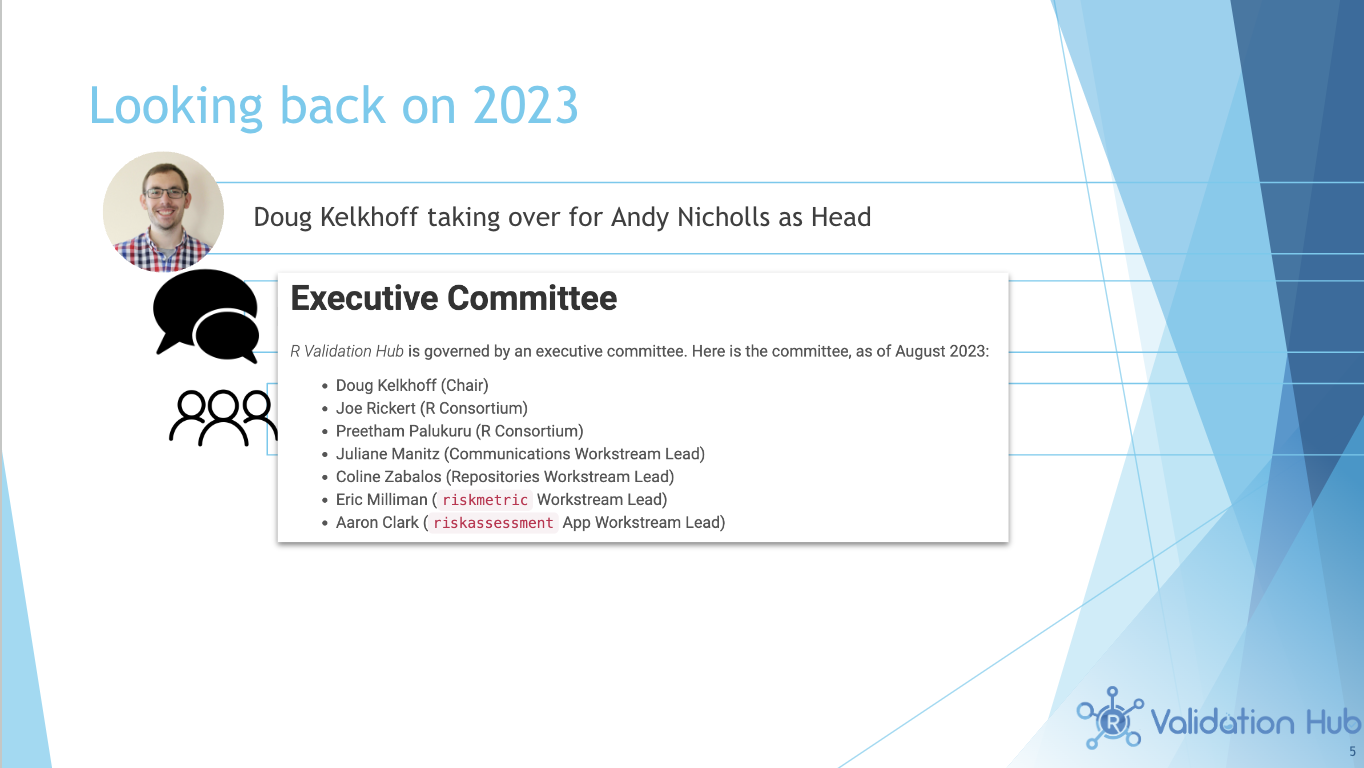
After a brief hiatus, the R Validation Hub recently reconvened for its community meeting, celebrating a year of remarkable achievements and setting the stage for future endeavors.
If you want to connect with us in 2024, please do so! The Regulatory R Repository workstream supports a transparent, cross-industry approach of establishing and maintaining a repository of validated R packages. Join us!
Meeting Notes
In 2023, a new R Validation Hub structure, including Head, Executive Committee, and workstreams, was established. Doug Kelkhoff is taking over for Andy Nicholls as Head. The executive committee governs the R Validation Hug. Here are the committee members, as of August 2023:
Contributed post by Mike Smith, Senior Director Statistics at Pfizer
Photo credit: R-Ladies at LatinR 2023
There’s likely a group of people meeting fairly near where you are right now, regardless of where you are in the globe, discussing how they use R in their work, research, or just for fun. If you feel like you’re the only person using R and struggling to keep up with latest developments or are feeling “stuck” and needing some advice or input, that’s where the growing network of R communities comes in.
R Communities are great places to learn, share, or just meet up with like-minded people. Local and regional R community meetings like R User Groups and R Ladies tend to be smaller in size than conferences, so you are less likely to feel overwhelmed by numbers or a mismatch between your level of comfort and expertise in R compared to others.
If you can’t make it in person, there are also online communities and groups and huge array of video content on sites like YouTube where videos of webinars and meetups are shared. So come along, sign up,and see what the global R community has to offer.
Madrid R Users Group (RUG) is a community of industry professionals from a diverse range of backgrounds that provides a learning and networking platform. The organizing committee of the Madrid RUG recently engaged in a conversation with the R Consortium regarding the use of R in their respective industries. The organizers, Carlos Ortega, Pedro Concejero, Francisco Rodriguez, and José Luis Cañadas shared their valuable insights about the industry’s evolving landscape of R applications.
Please share about your background and involvement with the RUGS group.
Francisco: I began learning the R programming language in 1999 when I started my Ph.D. program. R was primarily used for command-line programming, but I did not use it seriously until 2012, 16 years later. Since then, I have used R in various enterprise settings, including insurance companies and banks. I have used R to process data and build models, and I continue to use it in my current role in the financial sector.
Carlos: I began my career at AT&T Microelectronics, a semiconductor plant in Madrid. We collaborated with Bell Labs, who invented R and used it heavily in the manufacturing plant. We collaborated with many colleagues, including John Chambers and his team. Some of their team members in the statistical group at Bell Labs laboratories were in our plant, sharing their code. When they started using R, we also started using it. However, the factory has since closed.
I transitioned to the consulting industry, working independently without formal affiliation to a particular sector. I analyzed data in various industries, including finance, manufacturing, and telecommunications. I worked in consulting for several years, and later with Francisco at a Spanish telecommunications company called Orange, and previously in the banking sector. We applied various models, analyses, and algorithms using distributed computing on servers and clusters.
I am currently employed in the service sector for a multinational human resources company. We place thousands of people into employment. Since the 1990s, I have used R to model, analyze, and clean data for many years.
Jose Luis: I am a statistician employed by Telco in Orange, Spain. I have been working in Orange for approximately five years. My primary job is to work with a Spark cluster using “sparklyr”, and the H2O library “sparkling.” I am a big fan of “sparklyr,” tidyverse, and dplyr. dplyr and sparklyr are the most useful tools for my work.
Pedro: My academic background is in psychometrics, and I have used nearly all the major statistics software, including SAS and BMDP. I came to R when I started working in data science for my previous company, Telefonica. In 2011, I began learning R on my own, and I enjoyed it immensely. I then met some people I am working with now when I started teaching psychometrics with R at the university. They thought I was crazy, but I enjoyed it, and it was a success. I then worked on many projects at Telefonica, including social network analysis with iGraph. I particularly enjoyed making prototypes with Shiny.When Shiny first appeared, it was a marvel, especially for those of us in data science who wanted to create systems, web pages, and prototypes. It was quite successful. I left Telefónica four years ago, and I miss it sometimes. Now I teach text mining and artificial intelligence at the university. I use Python for artificial intelligence, as I find it a bit easier. But I teach the rest of the machine learning and text mining with R.
Can you share what the R community is like in Madrid?
Carlos: As I mentioned before, we meet monthly. We work in different sectors: Francisco in insurance and finance, Jose Luis in telecommunications, me in services, and Pedro in education. Pedro previously worked in telecommunications as well. Most of the people we invite to our sessions are from industry. We invite a few people from academia from time to time, but most of our activities and recent developments are from industry. Therefore, industry is currently the focus of our group.
I joined this group because of its diversity, especially in the applied world. Many people are working on different projects, and their diverse ideas can be inspiring. In this sense, I believe that academics sometimes become too engrossed in their circles. The real-world applications of R are found by meeting people with diverse backgrounds.
Pedro: All of our meetings are recorded and uploaded on our website since 2010 or 2011. The credit for this goes entirely to Carlos who has consistently maintained this website.
Why do industry professionals come to your user group? What is the benefit for attending?
Carlos: The most important part of the meeting is the social events that take place afterward. The meeting itself typically lasts 40-45 minutes, during which we present new things, such as applying the Spark package or H2O library. Recently, Francisco presented how to apply a scorecard method for risk models in banking. Pedro presented how to use Shiny or Shiny mixed with GLMs or other types of models. Many people attend these meetings to see how effective R is in the real world. After the meetings, we discuss the state of the industry, such as which companies are betting on R and where the good projects are. This is a great way to socialize and discuss our issues.
Pedro: Now that Carlos has introduced the topic, I believe that the debate between Python and R is pointless. In my experience, both languages can be used seamlessly, and there is no difficulty in switching between them. My experience at Telefonica has shown that the choice of language can depend on the background of the project team, but ultimately, the results are the same. However, I must mention that the documentation available for R is excellent. I believe that R has a significant advantage over any other framework in the industry for statistical modeling.
The vignettes for packages are particularly helpful, as they provide detailed information on how to use the packages. Additionally, I believe that it is much easier and faster to start doing data science in R than in Python. Python is chaotic, with different versions of the language and packages being released frequently. R is more homogenous, with backward compatibility being a priority for the R Foundation. This makes it much easier to maintain a consistent environment in R.
While Python may be easier to use for some tasks, I believe that R is the better choice for professional data science work. It is more stable, has better documentation, and is more widely used in the industry.
Shiny in Python was released this year. However, when I teach about Shiny in Python, I tell my students to read the documentation in R. This is because the two languages are very similar, with only minor differences. For example, ggplot and Shiny are both available in both languages. As a result, students can simply copy and paste code from the R documentation and use it in Python. This will allow them to quickly and easily create powerful applications.
Francisco: The process of creating training, connecting to a database, extracting data, viewing the data loosely, creating a button, and distributing all the applications to all the people in your enterprise is relatively straightforward. However, the security of the data must be taken into account. If the data is compliant with GDPR and can be shared, then it can be quickly made into an application that can be viewed on a mobile phone. This can be done in Python, but it is more difficult. I prefer to use R for training.
Jose Luis: The use of plumber or other API packages has made it easier than ever to deploy R models in production. Kubernetes and Docker have made this possible.
Carlos: The approach to production is changing significantly with PosIt (former RStudio). Rather than having packages isolated, the focus is shifting to how to produce models in the enterprise. This means bringing R and Python closer to a real environment. These packages are making things much easier.
Pedro: For example, when I teach machine learning, I often use Python. However, when I get to mixed models, which I know José Luis is interested in, I have to recommend that students install an R library. This is because no Python library for mixed models is as comprehensive or well-developed as the ones available in R. At least two years ago, this was the case. I believe that R is currently years ahead of Python environments for statistical analysis.
What trends do you currently see in R language and your industry? Any trends you see developing in the near future?
Francisco:In my sector, banking, I remember that 15 years ago, SAS totally dominated the modeling part. Before 2010, it was the best option. It was not only a language but also a solution that allowed you to create a core model easily without coding. However, it was very expensive. Nowadays, I have noticed that R methods have been appearing in the industry since around 2015 or 2016. For example, in 2017, I was a consultant and taught a course to the regulator here in Spain. The Central European Bank wanted to use R to inspect bank entities, which was surprising to me, as I had not expected another country to use software other than SAS. Currently, we are testing R using a library created in 2020 called “scorecard,” which I believe is a powerful library.
This library, with only a few lines of code, enables building a complex model step-by-step and putting it into production easily. In my current job, I can use SAS or R. Here, given the choice, I use the easier and faster one, which is R. You can access data quickly with R, without any issues with the network. You use your computer’s memory, which gives you a lot of freedom to use the data you want.
I believe that the flexibility of this library in particular is causing many data scientists to transition to open-source. It includes people who use Python since Python has copied this library, “scorecard.” Formerly, one had to pay to use it. The quality of the model is comparable, if not better. What you are using here is a logistic regression.
Carlos: In the service sector, the use of dashboards has been on the rise. Power BI, in particular, has seen a significant increase in popularity, surpassing Tableau. QlikView has all but disappeared from the market. Now, the two leading dashboarding platforms are Power BI and Tableau. However, I believe that the industry is poised for a major change. R is a powerful tool, but it requires a machine with the R engine installed. Imagine being able to use R in a serverless mode, like in WebR, even through a web browser. This would revolutionize the industry by eliminating the need to pay for licenses. Dashboards could be published and shared with colleagues for free.
In essence, the way we expand will change significantly, as we will use R or Python to make it very easy to create and distribute dashboards at no cost. I believe this change, as well as the things that are working now at Posit, could have a major impact on our industry but especially in the service sector, where we use a lot of different dashboards.
Jose Luis: I agree with Carlos, but I must point out that QlikView is still in operation. As you know, I worked with you at Orange, and I can assure you that Qlik is alive and well. Recently, I have been using Quarto to create reports for my customers and business owners. I have found Quarto to be an effective tool for communicating my results. I have used Quarto to create slides, reports, and interactive documents. I am very pleased with Quarto’s ability to help me share my analysis. I may also use “conflr” library to create analyses in R markdown and publish them directly to Confluence. This would allow me to create an analysis and immediately publish the documentation, which would be a great time-saver.
Pedro:You inquired about what we miss or would like to see in the R environment. I am not familiar with the web services provided by Posit or RStudio. However, I would like to see something similar to Google Colab. Google Colab for universities is a marvel. You have access to really powerful machines and a lot of RAM for free. It is a freemium service, but you can still use it. I am not aware of an equivalent in the R sector.
Carlos: Posit Cloud’s free tier provides a very small account with only one gigabyte of storage. This is insufficient for many users, especially those who need to use GPUs for machine learning or data science. Posit is not as powerful as the Google Colab Platform. It would be beneficial for Posit to offer a GPU-enabled tier for users who need more powerful hardware.
Carlos: The use of GPUs in deep learning is a topic that is open to debate. Python dominates the field, and has a wide range of packages and libraries available for deep learning, such as PyTorch. R has an older library for deep learning, but it is not as widely used as Python. Many of the latest developments in deep learning, such as generative AI, are primarily done in Python. Therefore, for R to be used more widely for deep learning, it needs to have faster and more compatible libraries, as well as a more user-friendly interface.
Pedro: The development of R is progressing at a rapid pace, perhaps too quickly for the requirements of R libraries. This is because the libraries are constantly changing, with major changes occurring every six months. As a result, users must keep a close eye on the third number in the library versions to ensure that they are using the latest and greatest version. This can be a bit messy, but it is also exciting to see the language evolving so quickly.
Jose Luis: I used iGraph and visNetwork to conduct social network analysis on mobile phones in order to communicate my findings. I also used Spark to perform social network analysis (library Graphframes), but I presented the results to my customers using R. It was a large project.
Any upcoming projects that you might want to discuss?
Jose Luis: I have an upcoming talk planned in which I will discuss the use of R in production. You have seen API, Docker, and other technologies. Perhaps sharing Azure in AWS and Google Cloud. I believe I attempted to teach too much. However, it may be beneficial to teach others how to use R in production. I would start with simple automation, such as using the cronR R Package and taskscheduleR in Windows. The next step would be to use an API. Then Docker. Then Kubernetes. Finally, publish and deploy on a cloud platform.
Carlos:In my case, I calculate projections for different types of time series on a monthly basis. This can involve up to 3,000 to 4,000 different time series, which are calculated automatically and in a distributed manner. These projections are already in production, and I use them to track different KPIs for different economic sectors in Spain. This is of great importance to my industry, as it allows us to identify which sectors are growing and which are declining so that we can invest in the right areas. This is a live system that is of great value to us.
Francisco: In my case, I am working on the first level of the problem that Jose Luis mentioned. My objective is to predict which customers are likely to default on their payments. After a customer makes a purchase online, they have to pay the first installment. My goal is to predict the probability that the second installment will not be paid.
I have developed a fully automated process that collects all the data from a SAS database. The process extracts the data, loads it into a model, applies the model, and then prepares the data for another application. The other application uses a model to prioritize customers who are likely to pay, and then selects a subset of customers to send SMS or email reminders to.
This process is fully automated and runs every day between 10am and 6pm. It takes only five minutes to complete.
Pedro: In my case, I will be presenting a paper on psychometrics at the Barcelona Congress. Psychometrics is a niche area of statistics that focuses on psychological measurement. R is the only software that offers advanced psychometrics models. I will be using one of the oldest but still classical models. I have prepared a table of the current status of psychometrics models in R, which I may include in my presentation. This is because R is the only option for psychometricians nowadays. The big suites do not offer this software. This is another example of why R is the only way to go for these niche areas.
How do I Join?
R Consortium’s R User Group and Small Conference Support Program (RUGS) provides grants to help R groups organize, share information, and support each other worldwide. We have given grants over the past four years, encompassing over 65,000 members in 35 countries. We would like to include you! Cash grants and meetup.com accounts are awarded based on the intended use of the funds and the amount of money available to distribute.
Mark Padgham, a Software Research Scientist for rOpenSci, has decades of experience in R, C, and C++, and maintains many packages on CRAN. Mark is leading the development of the deposits R package. Mark has been supported throughout this project by rOpenSci staff.
Publicly depositing datasets associated with published research is becoming more common, partly due to journals increasingly requiring data sharing and partly through more general and ongoing cultural changes with data sharing. Yet data sharing is often seen as time-consuming, particularly to meet the expectations of individual data repositories. While documentation and training can help familiarize users with data-sharing processes, browser-based data, and metadata submission workflows can only be so fast, are not easily reproduced, and do not facilitate regular or automated data and metadata updates. Better programmatic tools can transform data sharing from a mountainous climb into a pit of success.
deposits is a universal client for depositing and accessing research data in online deposition services. It provides a unified interface to many different research data repositories, which functions like dplyr, through “verbs” that work identically across many backend data repositories.
Currently supported services are Zenodo and Figshare. These two systems have fundamentally different APIs and access to deposition services has traditionally been enabled through individual software clients. The deposits package aims to be a universal client offering access to a variety of deposition services, without users having to know any specific details of the APIs for each service.
The deposits package works seamlessly with the “frictionless” data workflow, to enable unified documentation of all aspects of datasets in one place.
Outside of his work at rOpenSci, Mark has a passion for urban environments and understanding how cities can be improved. He is the lead developer of the Urban Analyst platform, ‘a platform for open-source, open-access interactive visualizations of urban structure and function.’ Mark says, “Cities cannot learn; therefore, I built a data platform for cities to learn from one another.”
RC: Doesn’t data sharing take too much time and too much effort? What is Depositsand what does it do? What problem are you solving?
Data sharing takes time and effort; everyone sharing from different places makes it hard to sync up. However, the deposits R package creates a common workflow for R users. It aims to streamline the data-sharing process.
It addresses the issue of disparate data-sharing locations by creating a standardized workflow, simplifying the process for researchers. All deposits are initiated on the nominated services as “private” deposits, meaning they can only be viewed by the deposit owner until the owner decides. A deposit can only be publicly viewed once it has been published. The process of using deposits to prepare one or more datasets for publication involves multiple stages of editing and updating.
RC: How far along are you on the project? Currently supported services are zenodo and figshare. Will you be adding more?
Currently, the project provides support for Zenodo (CERN’s Data Centre) and Figshare (Open Data) as the initial services. There are plans to expand and include more repositories in the future.
The team is working on integrating additional services, and there is a possibility of securing further funding for the Harvard Dataverse system, which operates as a federated rather than a centralized system. Integrating the DataVerse system presents additional complexities due to its federated nature, requiring more intricate API handling with greater flexibility but potentially posing challenges in adopting the workflow.
RC: Have users contributed their own plugins to extend functionality to other repositories?
deposits is implementing a modular/plugin system to enable users to contribute their own plugins to extend functionality to other repositories. Users will be able to authenticate, prepare data and metadata, and finally submit, fetch, and browse data.
Actual activity around plugins has been a little slow so far. We are writing a JSON Schema for the system which will improve the process. We will be seeking people to build plugins after more adaptations are done and documented. Actually, I would not recommend regular users try to extend deposits to other repositories yet. But that is coming soon!
Preparing the data is a barrier, mainly during preparation. deposits is made to run workflows, documenting all the columns in a data table. By using deposits, there will be a completely painless, single update function.
RC: What was your experience working with the R Consortium? Would you recommend applying for a grant to others?
Yes! The application process was painless and straightforward. In fact, I got a second grant recently. I’m very thankful for the support.
The only off-putting part of the process was no guidance on how much to ask for. You are fully enabled to submit it on your own. This is good, and I appreciate the outcome, getting financial support. But giving applicants better overall guidance would be very helpful. The R Consortium should make the application process more inclusive with more consultation.