After serving as chair of the board for the R Consortium and being involved in multiple R Consortium committees both on the technical and community development sides, as well as participating directly in R-focused events, webinars, and countless other R activities, Joseph Rickert is stepping away from the position. The board will be conducting elections to decide the next chair.
Joseph has been with the R Consortium since it was first conceived in 2014. His initial role was as Community Officer. In 2018, he began to also serve as Secretary. In 2019, he was elected chair of the board.
Thank you for your tireless interest in promoting R and supporting developers and user groups around the world who are working to improve the R programming language.
The R Validation Hub recently had its community meeting after a brief hiatus. The team discussed announcements, common challenges, and brainstormed ideas for possible future projects through the R Validation Hub. Here are some highlights of their meeting. Stay tuned for the next monthly community meeting, dates to be announced!
📢 Announcements
We have some announcements about R Val Hub leadership and structure! Doug Kelkhoff, Principal Data Scientist / Statistical Software Engineer at Roche, will be taking over the R Validation lead role from Andy Nicholls.
Doug Kelkhoff has been supporting the adoption of R in the pharmaceutical space for the past 6 years. During his time at Roche, he has pushed the adoption of R through pilot clinical trials, showcasing the benefits of using R by crafting internal tools and building services that embed the R Validation Hub’s guidance as part of our software development lifecycle. He is passionate about making the use of open source tools in a regulated setting a viable path not just for large pharmaceutical companies, but for lean startups and the public sector by addressing challenges through open initiatives. We welcome Doug as the new lead!
Andy Nicholls, Senior Director, Head of Data Science at GSK, has been the lead of the R Validation team for over four years. He has greatly contributed to the working group, including his work with the R Adoption Series, presenting eight recent case studies covering how the R Validation Hub guidance is being put into practice across many of our industry partners. These case studies covered building a Gxp framework with R: https://www.pharmar.org/casestudies/
Thank you, Andy, for the contributions and leadership you brought to the R Validation Hub! 🏅
Interested in supporting the R Validation Hub with its communication workstream? We need volunteers to help us with improving consistency with branding, communication channels, and year-long planning, contact us: https://www.pharmar.org/contact/
Call To Action for the Community 👋
During the community meeting, the team had discussions about how people use the riskmetric package for their evaluation processes and what they deem as too high-risk scores.
💡 CDISC data should be the standard for add-on unit testing, a common repo from the R Validation Hub would be very welcome.
💡 Finally, we discussed who reviews R packages, including what is the role of software engineers, statisticians, and clinical experts. Join us in the next meeting to share your thoughts!
Mustafa Cavus, organizer of the Eskisehir R User Group, in Turkey, discussed the diverse and thriving R community in Eskisehir. He shared the details of a 4-day event hosted by the group, which covered beginner-level talks and advanced topics for expert users. He also shared some useful techniques for hosting successful events.
mi2.ai in Warsaw University of Technology, Poland
Please share your background and involvement with the RUGS group.
I am working as an Assistant Professor at Eskisehir Technical University, Department of Statistics. My teaching work focuses on Machine Learning, Data Visualization, and Statistical Hypothesis Testing using R. Additionally, I am actively researching Explainable AI at mi2.ai.
I have a Ph.D. in Applied Statistics and have gained post-doctoral research experience at the Faculty of Mathematics and Information Science, Warsaw University of Technology. My journey with R started during my undergraduate years, and it has greatly advanced my academic career.
Inspired by the productivity and impact of local R groups and events worldwide, my colleague Ugur Dar and I decided to establish a local R user group in Eskisehir in 2019. Our aim was to foster a vibrant user community within our region.
Can you share what the R community is like in Eskisehir?
The pioneer R users in Eskisehir primarily come from academia, focusing on teaching and research. This group consists of undergraduate students from various disciplines who seek to enhance their skills in data-related fields, as well as graduate students and researchers engaged in analytical research. In recent years, there has been growing interest from diverse industries, including finance, medicine, and more. The group’s areas of interest encompass data visualization, descriptive analysis, and predictive modeling.
Eskisehir Technical University Data Science Society in Eskisehir, Turkey
You had a Meetup Learn R, can you share more on the topic covered? Why this topic?
We organized a four-day event on Learn R, which took place on November 13th and 26th, as well as December 17th and 19th. This event was a collaboration with the Eskisehir Technical University Data Science Society. Throughout the event, we delved into various aspects of R, starting from the basics and progressing toward designing user interfaces using R.
On the first day, we commenced with the session “Introduction to R Programming,” covering topics such as understanding the essence of R, effectively handling error messages, and exploring basic data types, data structures, operators, loops, and functions in R. We provided hands-on examples to reinforce learning.
Introduction to R Programming Tutorial by Mustafa Cavus
The subsequent session, “Data Manipulation with R,” focused on the practical applications of the {dplyr} package and its functions for manipulating data.
Once participants had gained a glimpse of R and acquired useful data manipulation skills, we proceeded to advanced topics such as “Data Visualization with {ggplot2}” and “Designing User Interfaces with {Shiny}.” These sessions were led by Ugur, an expert in these fields, who actively applies these techniques in the banking sector at Visbanking.
Data Visualization with {ggplot2} Tutorial by Ugur Dar
Our primary goal in selecting these topics was to enhance the skills of individuals who were new to R or had only a beginner-level understanding. Furthermore, we aimed to provide initial training to meet the increasing demand for human resources in our country, particularly in areas such as data visualization and user interface design.
Who is the target audience for attending this event?
As you know, the COVID-19 pandemic obligated a shift to online events. Fortunately, organizing such events now allows us to reach a wider audience. Initially, we had planned for this event to be a face-to-face gathering primarily for undergraduate students in Eskisehir. However, in response to numerous requests, we decided to change it to an online format. This modification enables not only participants from Eskisehir but also participants from all across Turkey who are interested in learning R to have easy access to the event.
With the aim of attracting a diverse range of participants, we have carefully prepared comprehensive content that caters to both beginners and those seeking more advanced knowledge. Our curriculum covers fundamental concepts and progressively delves into advanced topics.
Any techniques you recommend using for planning for or during the event? (Github, Zoom, other) Can these techniques be used to make your group more inclusive to people unable to attend physical events in the future?
Certainly! We now have access to many online platforms and tools for hosting events, and the options available continue to expand rapidly. It is crucial to consider the familiarity of the target audience with the chosen tools to ensure a positive experience.
For our event, we decided to use the widely-used Zoom platform, which is prevalent in Turkey. We also made the training materials available in a public repository on GitHub. Additionally, we uploaded the recordings on YouTube, allowing those who missed the session to catch up.
We think that comprehensive documentation of an event enhances its impact and longevity. The content we developed for this particular event is expected to serve as a valuable resource for individuals interested in learning R for years to come.
Lastly, in order to gauge the effectiveness of an event, we encourage participants to provide feedback using tools such as Google Forms. This valuable feedback will aid us in planning future events more efficiently.
Please share any additional details you would like included in the blog.
Thanks. I would like to express my gratitude to Ugur for his invaluable support in our R initiatives. Additionally, I extend my appreciation to Gizem Altun, Seyma Gunonu, and Zeynep Afra Sezer for their exceptional organizational contributions.
Mustafa and Ugur in Gdansk, Poland
Our city and country are home to numerous enthusiastic R users, and the opportunity to meet and exchange experiences with them is an integral aspect of R users’ culture. Finally, I extend an invitation to all those who are interested to reach out to us and actively participate in our events. We firmly believe that knowledge becomes more useful when shared.
Greetings from Eskisehir to the R community! 👋
How do I Join?
R Consortium’s R User Group and Small Conference Support Program (RUGS) provides grants to help R groups around the world organize, share information and support each other. We have given grants over the past four years, encompassing over 65,000 members in 35 countries. We would like to include you! Cash grants and meetup.com accounts are awarded based on the intended use of the funds and the amount of money available to distribute. We are now accepting applications!
The R Consortium is sponsoring the New York R Conference, presented by Lander Analytics! This in-person and virtual conference will be running from July 13-14, with workshops (tickets sold separately) from July 11-12. The New York R Conference grew out of the New York Open Statistical Programming Meetup (also known as the New York R Meetup), with currently over 14,000 members. Topics from the meetup include data science, visualization, machine learning, deep learning, and so much more. The New York R Conference is where enthusiasts and data scientist gather!
Will you be attending? Let us know! Use promo code RSTATS20for 20% off conference & workshop tickets.
The conference gathers data scientists and professionals from all over the world. This year the conference will include a series of talks covering topics like creating beautiful maps, using OpenAI Embeddings API, data-driven approaches to marketing, using data for journalism, and much more!
There will be workshop sessions from July 11-12. Workshops are a way for generating revenue for OS developers, workshops will include:
Causal Inference in R by Malcolm Barrett & Lucy D’Agostino McGowan Tidy Time Series and Forecasting in R by Mitchell O’Hara Wild
🎙 Join Jon Krohn with special guest Chris Wiggins, Chief Data Scientist at The New York Times and Associate Professor of Applied Mathematics at Columbia University, for the SuperDataScience live podcast.
Ari Lamstein is a Director of Analytics at MarketBridge, a Marketing Analytics Consultancy.
Back in 2018, when I was most involved in developing choroplethr, Joe Rickert, R Consortium Director, recommended that I submit a proposal to the R Consortium to create a Working Group related to Census data. I was intrigued to see what a group like that could accomplish and submitted a proposal. The proposal was accepted, and the group’s main accomplishment was publishing A Guide to Working with Census Data in R. After publishing the Guide, however, the group went dormant.
Fast forward 5 years, and last month I published a new package related to Census data: zctaCrosswalk. When discussing the package with Joe he mentioned that he recently spoke to some leaders at Census who were interested in revitalizing the R Consortium Census Working Group. He asked me if I was interested in meeting the people who were interested, and of course I said yes!
We just had a preliminary meeting, and several exciting ideas were discussed. One is to write a new version of ‘A Guide to Working with Census Data in R.’ We are still in the early stages of deciding what a new version might look like, but one goal would be to remove links to deprecated software such as American FactFinder. More broadly, the original guide was written as a survey of both Census data and CRAN packages. Perhaps the Guide might be more useful if it was written more as a tutorial to the most popular datasets and packages.
We also discussed ideas for longer-term projects. For example, applying for funding from the R Consortium, and directing that funding towards the development of R packages that might improve the R ecosystem for Census data.
If you have an interest in following our work or participating in our next meeting, please sign up below.
Join us for an update from the R Consortium’s R Validation Hub, which supports the use of R within regulated industries. The community meeting will be on June 27, 12 PM ET / 9 AM PT!
Summary:
Last year, the R validation hub initiated a three-part presentation series on “case studies.” Eight pharma companies presented their implementation of the risk assessment framework. We briefly summarize common themes and differences in the approaches. For the majority of the meeting, we want to discuss common challenges and brainstorm ideas for possible future projects by the R Validation Hub.
The R Consortium recently talked to Rachel Heyard of the Zürich R User Group to discuss the vibrant R community in Zürich. The group collaborates with different companies in Zürich to host events, providing network opportunities for the R community.
Rachel currently works as a post-doctoral researcher at the Center of Reproducible Science at the University of Zürich. She uses R for her work and for teaching in her course on good research practices.
Please share about your background and involvement with the RUGS group.
I received my Masters in Statistics from the University of Strasbourg, France, and my Ph.D. in Biostatistics at the University of Zürich, Switzerland. I started using R during my Masters for different projects and assignments. During my Ph.D. I became more proficient in it and also wrote my first packages. After my Ph.D., I left academia and worked for the Swiss National Science Foundation in Bern as a statistician.
I used R to analyze data on how the Swiss National Science Foundation is distributing funding to research projects and got to also do some research but this time research on research. I got very interested in what we call meta-science and decided to go back to academia. I have been working on my postdoc since October 2021 a postdoc at the Center for Reproducible Science at the University of Zürich. I do a lot of teaching: I am teaching good research practices to Ph.D. students and postdocs from different disciplines.
I joined the R User Group organizing committee at the end of my Ph.D. We were very regular before Covid and had meetings every six weeks to two months. Different companies hosted our events, and we had nice aperos that were sponsored. We got a little stuck during Covid and decided against hosting online events. We felt that there were a lot of online events happening and we couldn’t add much to it. Our meetups are more about the networking and community aspect and less about the talks. We also have this setup where people can pitch a job or people who are looking for a job could pitch themselves. It really brings people together at the apero. We felt that this community aspect would be missing in online meetups.
After things settled down a bit, we tried organizing a few meetups, but we struggled to gain momentum in the team. However, now we have planned three sponsored events for this year. One in July, one in September, and one in November. We are hopeful that it will work out and we will gain momentum again with the meetups.
Can you share what the R community is like in Zürich?
It is actually very diverse, and we have a lot of people from different domains. There are many from academia as we have two big universities in Zürich, the University of Zürich and ETH. Data journalists are attending, as well as people from re-insurance, official statistics, pharma, and other fields.
What industry are you currently in? How do you use R in your work?
I currently work in academia and I teach a block course on Good Research Practices. We teach the steps of good and reproducible research including starting with a study protocol and then registering this study protocol. We also teach them all kinds of steps to avoid questionable research practices like p-hacking.
Part of this course is two hours on dynamic reporting with R as well as another hour on how to use Git for version control. The course is very interesting because participants are early career researchers doing their Ph.D. or postdoc. They all come from very different fields and some already have some experience in R while others are using it for the first time. So you never know what’s gonna happen in the course. Sometimes it is easier to teach the course because the participants are familiar with R. Other times it’s really difficult because they are all coming from different backgrounds and some have never used R before. So you have to be very dynamic in teaching and adapt to the level of the participants. The goal is not to make people who’ve never used R or R Markdown before proficient in R. It is to have them experience it once and see the benefit. Maybe get them interested in it, hoping that they use it in the future or learn more about it.
What trends do you currently see in R language and your industry? Any trends you see developing in the near future?
I need to follow the latest trends more often. For example, I am still teaching R Markdown but we have been thinking about switching to Quarto. That might be a big development because some of our participants are Python users. So for them, it might be good to use Quarto because it’s easier to use with Python.
When I did my Ph.D. I was a base R user and at the university, people are still using a lot of base R. When I left academia to join the Swiss National Science Foundation, I started using tidyverse and also got proficient in it. It is so much easier to handle messy data and do data processing with tidyverse.
Now that I am teaching R, I also teach tidyverse. For people who are not statisticians like me and have to do a lot of data handling, tidyverse is much easier to get into as compared to base R. That’s not very recent anymore but for me, it’s one of the biggest changes I saw for my personal work.
Any techniques you recommend using for planning for or during the event? (Github, zoom, other) Can these techniques be used to make your group more inclusive to people that are unable to attend physical events in the future?
I think Slack is a really great tool for organizers. It’s an asynchronous conversation that you can always go back to. We also collect ideas for speakers in a Google doc. Whenever we talk to somebody who could be interested in giving a talk, we quickly write down their name and contact details. So whenever we need a speakers we go back to this document.
I also feel that it is very productive for the organizers to meet in person and have a drink or coffee together and discuss. Because it feels more urgent and is great for discussing future meetups. While Slack is great at times we might forget about conversations when we get busy.
How do I Join?
R Consortium’s R User Group and Small Conference Support Program (RUGS) provides grants to help R groups around the world organize, share information and support each other. We have given grants over the past four years, encompassing over 65,000 members in 35 countries. We would like to include you! Cash grants and meetup.com accounts are awarded based on the intended use of the funds and the amount of money available to distribute. We are now accepting applications!
The R Consortium has begun the disbursement of grants to help R User Groups (RUGS) around the world organize, share information, and support each other. We are currently accepting applications until September 30, 2023!
With these grants, the R Consortium looks forward to facilitating and supporting the person-to-person exchange of knowledge in small group settings on a global scale. RUGS grants are intended to help people form enduring R user group communities. The RUGS program is supporting both virtual and in-person events.
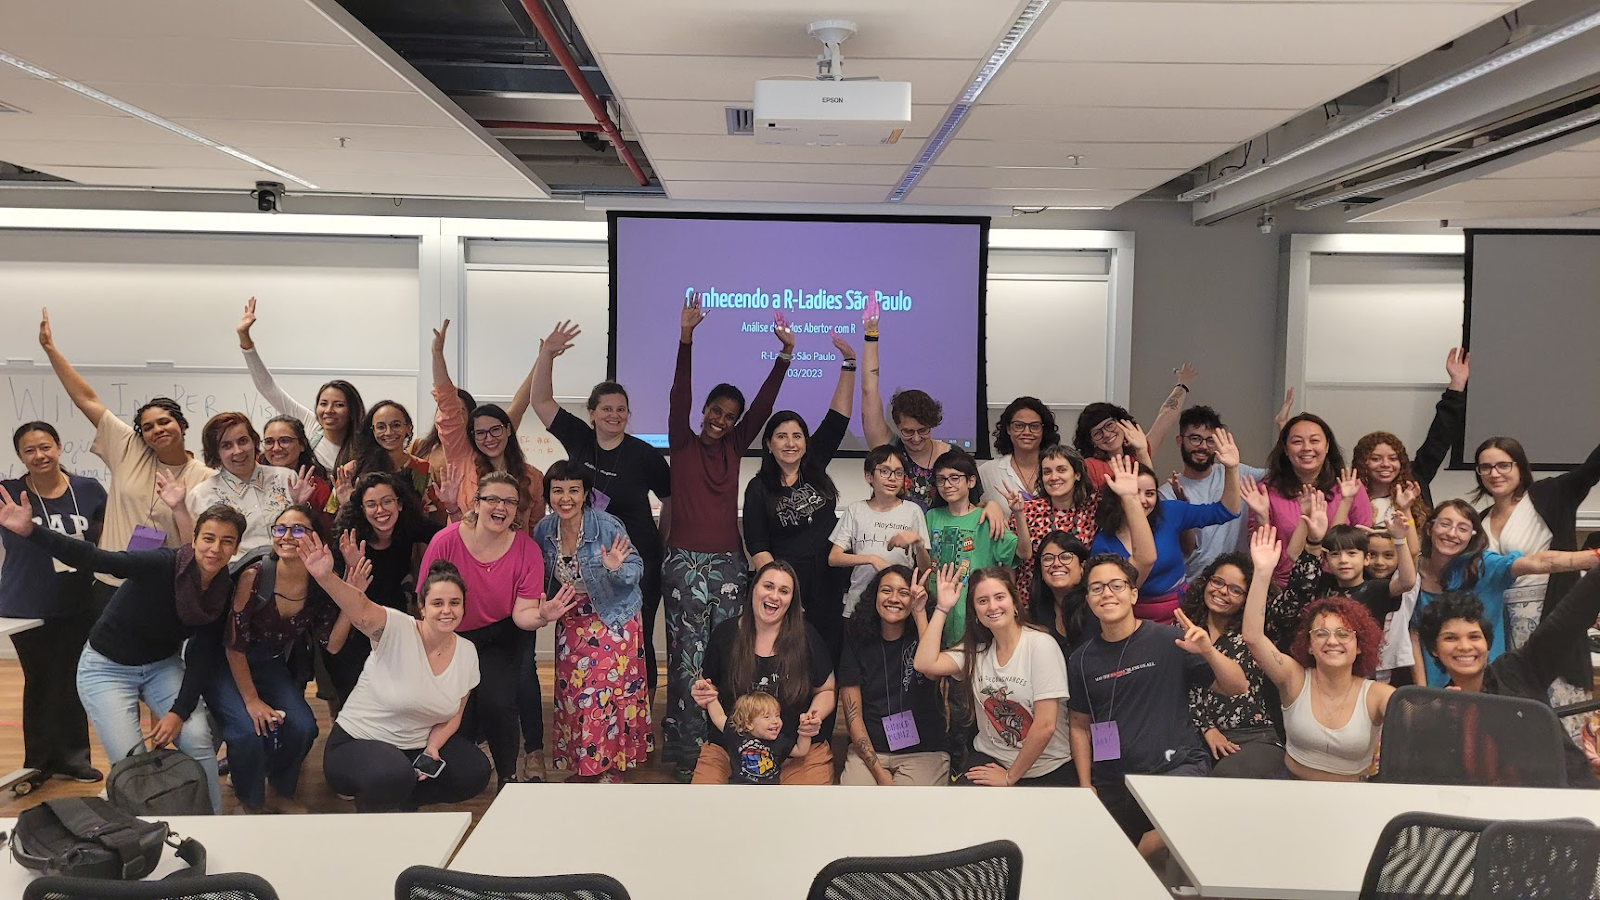
Beatriz Milz, teacher at Curso R, Ph.D. Student in Environmental Science, and co-organizer of R-Ladies São Paulo, recently received a grant from the R Consortium. The grant was requested to help facilitate R-Ladies São Paulo Meetups which host 40-50 people per meeting. The Group intends to use the funds to continue to host events for locals of the São Paulo area. With the funds provided, the group has been able to offer transportation assistance for low-income participants that otherwise can’t come to the event, children caretaker per event, R Swag, snacks, and team apparel. The group hopes to continue with its momentum and offer more meetups to new and experienced R users.
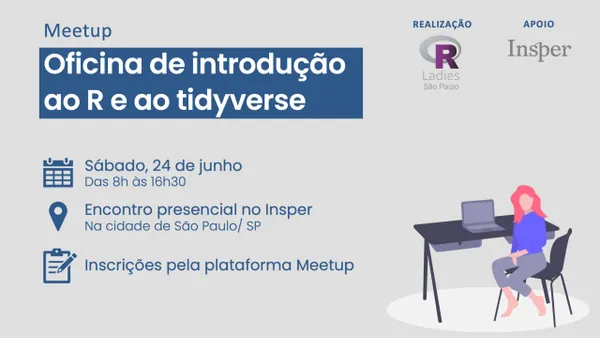
In these Meetups, R-Ladies São Paulo organizes different talks and trainings including some of their most recent ones:
The 2023 RUGS Program is currently taking applications and will close at midnight PST on September 30, 2023.
These grants do not include support for software development or technical projects. Grants to support the R ecosystem’s technical infrastructure are awarded and administered through the ISC Grant Program which issues a call for proposals two times each year.
Francisco Rodríguez Sánchez shared with the R Consortium how the R language has changed and improved his work as a computational ecologist, leading him to become a passionate advocate, professional, and promoter of R, especially in the context of environmental causes.
Francisco is a scientist specializing in computational ecology who works at the intersection of various disciplines, such as ecology, biogeography, statistics, and data science. His research focuses on understanding and predicting the effects of climate change on biodiversity. To achieve this, he combines field observations with computational approaches that rely on analyzing large datasets, complex statistical models, and reproducible workflows. He is also interested in developing new quantitative methods and computer tools that facilitate reproducible research.
Besides his research, he also teaches ecology, statistics, and programming, playing an important role as a founding member and coordinator of two groups: the ‘R Users Group’ in Seville and the Ecoinformatics working group of Asociación Española de Ecología Terrestre (AEET), both with the objective of promoting good statistical and programming practices among ecologists.
Among his hobbies, he enjoys being in nature, listening to flamenco music and playing the guitar, spending time with friends and family, traveling, and reading.
How was the creation of Seville R carried out? Was it well accepted by the community? What were the challenges you faced during the pandemic?
It has been a wonderful experience, full of ups and downs as it happens in many groups. Our first meeting took place at a cocktail bar here in Seville, where we were given space. Approximately 15 to 20 people attended, which was quite good considering Seville has around 700,000 inhabitants. Most of the attendees were colleagues, but we also had people who discovered the event through Twitter or maybe through our blog. For several years, we gathered there with great interest and turnout. Among other great talks, we were lucky to have Karthik Ram from rOpenSci and Romain François from Posit (Rstudio), who came together in the first year of the group’s foundation. At that time, dplyr had just been released and quickly growing up, so we had the scoop on how it worked, and it was very impressive. Karthik also gave an amazing talk on the importance of reproducible research. The news spread and many people in Spain started to closely follow the Sevilla R Users Group.
We held monthly or quarterly meetings, attracting people from both academia and the private sector, until the pandemic hit, and everything came to a halt. The pandemic times were challenging, and we had only one or two online meetings. We highly valued the opportunity to physically gather in a place. Usually, after the talks, we would go to a bar for a drink and continue discussing projects and what we were doing. Online meetings are more distant and colder; they do not motivate us as much.
In the online mode, during the live broadcasts, there were very few people connected, and there were rarely any questions. It was not so easy to achieve that sense of community. That is why we decided to stop the online meetings since we were all busy and did not enjoy that format as much. We were on pause for a while, but fortunately, we have resumed in-person meetings. Thanks to the addition of new people with a lot of energy and initiative, we are now quite active, and everything is going very well.
What’s your level of experience with the R language?
I am not a professional programmer, but I am self-taught. However, I dedicate a significant amount of time to learning and enjoying programming, as it is very useful for my work and helps me solve many of my problems. Over time, I have acquired intermediate to advanced-level knowledge through self-teaching. Although I am not a professional programmer and there are still many things that elude me, I consider myself quite competent in R. In my community, people usually come to me when they have programming or analysis problems; they know me as “Paco, the R guy.”
Please share about a project you are currently working on or have worked on in the past using the R language.
I use R mostly for teaching or developing research projects, but I have also developed several packages. One of the most recent is called CityShadeMapper. We worked on it last year, and we are currently in the final phase. This package, available on my GitHub, is used to create shadow maps in urban environments. Basically, it works as follows: LIDAR (Light Detection and Ranging) data, which are remote sensing technologies that accurately measure terrain heights, are downloaded from various sources. Many countries offer this data for free, so it can be downloaded from the internet. CityShadeMapper takes this remote sensing data and generates high-resolution shadow maps, at a one-meter level, for every hour of the day and throughout the year.
In other words, with this package, we can obtain detailed information about shadow intensity or lighting in every square meter of a city, both on building rooftops and at street level where pedestrians and cyclists are. It is important to highlight that CityShadeMapper utilizes infrastructure from other essential packages for its operation, but integrates them in a way that any user, citizen, or municipal administrator can easily generate shadow maps.
This tool is particularly useful in the context of climate change, as it allows us to identify areas with a lack of shade, which leads to high temperatures. I live in Seville, a very hot city in summer, and every year we face the issue and debate about the lack of shade. That is why developing this package has been a goal for us for years, as we believe it can be very useful. In fact, I know that some municipalities are already using it to improve urban planning and address the problem of shade deficiency. The CityShadeMapper package excites us a lot because we consider it a fundamental tool for climate change adaptation, not only in the Mediterranean but also in other parts of the world.
What was the objective and outcome of this project?
The project is still incomplete, there is a missing functionality that is in the prototype stage: the creation of shadow routes. These shadow routes work like Google Maps or a map service, but instead of taking the user on the shortest path, they guide you along a route that maximizes shade. In this way, you can walk through cooler areas during the summer and avoid the heat. Currently, we are working on finalizing this part of the project; it is something we have pending. We plan to start next month with tutorials and workshops for those interested in learning how to use it. We will publish all the information online. There is still more outreach needed, but I am confident that it will be useful, as several people have contacted me expressing their interest in starting to use it.
Would you like to mention something interesting about the R language especially related to the industry you work in?
Currently, I hold the position of university professor and researcher in ecology, and R has become by large the dominant language in our field. Therefore, it has become indispensable for research, both for doctoral students and researchers, who are learning and using it to carry out their work.
Furthermore, in the realm of teaching, I have always felt a great interest. Although I did not learn R through formal education and had to learn it on my own, I am passionate about teaching and how to provide effective instruction in programming and data analysis to individuals who are not programmers or computer scientists, who have no prior experience with code, and who may feel some fear or apprehension towards programming. However, once they start working with R, they usually love it and realize that they can acquire skills quickly. Therefore, both in teaching and research, R has become an invaluable tool.
As mentioned earlier, I also use R in all aspects of my work, whether it be creating graphics, designing slides for my classes, or preparing presentations. In summary, R is a versatile tool that I use in all stages of my academic work.
How well accepted is R in your community?
In my experience, most people get excited and really enjoy using R once they start using it. It is true that they may encounter difficulties at first, as it is their first time dealing with code, and they may feel some frustration with things like commas or typographical errors. However, in just a few hours, they usually perceive its potential and, despite the initial challenges, they become motivated to learn and explore all the possibilities that the language offers. In my role as a teacher, I teach both programming and data analysis, and I have observed that the R language, thanks to its design and the freely available teaching resources on the internet and in books, facilitates the progress and advancement of those who are starting out.
The R language is relatively easy to grasp, especially for those taking their first steps. However, when it comes to statistics and data analysis, I believe the complexity increases and more insecurities arise, requiring greater effort. Despite that, in general, the R language is very well received. In fact, there is a growing demand from students for R to be used in many universities, as they recognize its great potential.
That being said, I believe it is important to use teaching techniques that facilitate the first steps in R, especially for non-programmers. Teaching R to a computer scientist who is not afraid to open a terminal and start programming is different from teaching it to a biologist who has never written code. Therefore, I think it is essential to approach those first steps in a pedagogical way so that they can truly perceive the potential and make progress without feeling too frustrated. In my experience, the reception of R has been excellent.
What resources do you use?
I started using Posit (RStudio) since it came out on the market. I was very attentive to RBloggers and also followed the updates on Twitter. When I saw that RStudio was released, I decided to give it a try and was delighted with its functionality. Previously, I used a program called Tinn-R, but since I tried RStudio, I liked it so much that I continue to use it as my main working tool.
I also used Visual Studio for a few years, but currently, RStudio is my primary choice. In 2012, I started using GitHub. I discovered its usefulness on the internet, although it took me some time to learn how to use it fluently. Since then, I have been using it almost daily.
I became a big fan of RMarkdown many years ago and use it to create class slides, presentations, and to write papers, scientific articles, and theses. We have been using RMarkdown for years. Recently, we have also started using Quarto.
As for Tidyverse, I also use it extensively. I do not consider myself an expert in Tidyverse, as it is a broad and constantly evolving ecosystem, making it challenging to stay fully updated. However, I am in love with dplyr and dbplyr as they offer a lot of functionality for working with databases. I believe they have great potential and work excellently. Of course, I also make use of the entire ggplot ecosystem.
What would you say to anyone interested in learning R?
I would like to make a special invitation to include the teaching of programming languages to biology and environmental sciences students, as I consider it highly beneficial. Learning R provides students with numerous opportunities and opens many doors for them. Additionally, I would like to extend an invitation to everyone in Sevilla to get in touch with the Sevilla R group. We are delighted to welcome new people and share our knowledge.
Lastly, I would like to express my deep gratitude to the R Consortium for their ongoing support to local groups over the years. In Sevilla, our group has received various forms of support that have been extremely valuable in maintaining and strengthening these local communities, which I consider vital in energizing the R community as a whole. Our sincere appreciation for all the support provided.
Francisco was also interviewed in 2022, read more.
How do I Join?
R Consortium’s R User Group and Small Conference Support Program (RUGS) provides grants to help R groups around the world organize, share information and support each other. We have given grants over the past four years, encompassing over 65,000 members in 35 countries. We would like to include you! Cash grants and meetup.com accounts are awarded based on the intended use of the funds and the amount of money available to distribute. We are now accepting applications!
CAMIS is a PHUSE working group in collaboration with PSI and the R consortium. Initially, the repository contains R and SAS analysis result comparisons, however, the team hopes to extend to other software/languages in the near future. Their white paper will soon be available on the website. Please help the CAMIS team build a high-quality and comprehensive repository. Learn from the PHUSE WG below!
Are you trying to replicate results using different software/languages and struggling to find out why you can’t match the results?
The CAMIS repository stores documentation detailing the reasons for observed differences when performing statistical analysis in SAS and R. The repository is housed on GitHub and will be populated through open-source community contributions.
Differences between software could be due to different default and available options, including the methods being used. By documenting these known differences in a repository, we aim to reduce time-consuming efforts within the community, where multiple people are investigating the same issues. If you find an issue not already investigated, please log an Issue in GitHub. If you have time to investigate and document the reason for the issue, then please submit a pull request with the new content in a quarto file. Details of how to contribute can be found on the website.