The R Consortium recently hosted a webinar series tailored specifically for insurance and actuarial science professionals. This series, called the R/Insurance webinar series, led by experts Georgios Bakoloukas and Benedikt Schamberger, was crafted to guide attendees from transitioning from Excel to R to implementing R in production environments, fostering a performance culture with R, and mastering high-performance programming techniques.
Whether new to R or looking to deepen your expertise, these webinars offer valuable insights into leveraging R’s capabilities in your field. All sessions are now accessible on YouTube, providing a fantastic resource for ongoing learning and development.
The R Consortium talked to Barry Decicco, founder, and organizer of the Ann Arbor R User Group, based in Ann Arbor, Michigan. Barry shared his experience working with R as a statistician and highlighted the current trends in the R language in his industry. He also emphasized the significance of organizing regular events and effective communication for managing an R User Group (RUG).
Please share about your background and involvement with the RUGS group.
Throughout my professional career, I have gained extensive experience in various industries as a statistician. Statisticians are often thought of as either staying in one industry for their entire career or frequently transitioning between them. I have followed the latter path, having held positions at Ford Motor Company, their spinoff Visteon, the University of Michigan School of Nursing, the University of Michigan Health System, Nissan Motor Company, Volkswagen Credit (as a contractor), Michigan State University, and currently Quality Insights.
I have been using the R programming language consistently for several years now. I have extensively worked with R during my tenure at Michigan State University as a member of the Center for Statistical Training and Research (CSTAT). CSTAT serves as the university’s statistical laboratory. Our team heavily relied on R as our preferred software for statistical analysis.
Our reporting process involved using R Markdown reports. Steven Pierce, the assistant director, developed a highly complex and upgradeable system using R Markdown to process data. This system allowed us to initiate a report and then trigger the R Markdown file to process the data and generate the final datasets for each report. Another R Markdown file was then called to render the report. This streamlined process enabled us to produce about 40 PDF reports within 45 minutes. The process remained relatively straightforward when we needed to make modifications, such as changing the reporting period from fiscal years to calendar years or adding or subtracting individuals, units, or departments.
I have recently started a new job primarily working with the SAS programming language. Initially, I will focus on gaining proficiency in this area. After that, I will transition to performing more in-depth analysis and ad hoc reporting, requiring me to use additional tools and resources. I have also moved to a new system where we use Hive or Hadoop through Databricks. As part of my role, I am responsible for taking over the current reporting system and identifying future reporting needs. This will require me to use R extensively.
Before the COVID pandemic, the R users group met in Ann Arbor. However, the pandemic dealt a major blow to the group, and we are still recovering from its impact. In our efforts to revive the group, we continued with the same theme as before: a mix of programming and statistics. However, we have been focusing more on programming and simpler analysis to make it easier to get the group restarted. We have also introduced some new presenters covering topics such as machine learning pipelines in their presentations.
Can you share what the R community is like in Ann Arbor?
R has become a popular programming language in academia and will likely remain relevant in this field. However, general coding and applications are more prevalent in the industrial sector. Python is gaining popularity because it attracts a broader range of programmers, including those who are not data or analytics specialists. Therefore, R will continue to be a significant but specialized tool.
Currently, I have noticed a significant decrease in the usage of SAS. This trend is driven by the dislike of license fees among individual and corporate users. The matter is further complicated by corporate accounting practices, where different funding sources may have varying spending restrictions. As a result, organizations may end up incurring higher salary expenses because of the complexity of corporate accounting processes.
If a company spends a fixed amount, say $10,000, on SAS licenses yearly, it might not like it. But then, it may hire additional staff to do the same work SAS did earlier. The salary of these people, and other associated costs, may come from a different funding source. As a result, the company may spend a significant amount of money, ranging from $120,000 to $150,000 annually, to replace a smaller amount of $10,000 to $20,000 annually. However, whether this arrangement is acceptable would depend on the funding source.
Do you have an upcoming meeting planned? What are your plans for the RUG for this year?
Our next presenter, Brittany Buggs, Staff Data Analyst at Rocket Mortgage, will demonstrate the usage of the GT package for generating tables. Additionally, we are striving to establish closer integration with the Ann Arbor chapter of the American Statistical Association to foster mutual support and collaboration between the groups. We have been conducting hybrid meetings catering to in-person and virtual attendees. Ann Arbor Spark, a local startup business development organization, has generously provided us with a physical meeting space. Our meetings follow a hybrid format, recognizing the convenience and accessibility it offers to many individuals.
This year, I aim to have more presenters as I have been doing all the presentations by myself. I plan to raise awareness about R, R Markdown, and Quarto and show people how these tools can be useful. I will promote these tools at the University of Michigan and other companies.
What trends do you currently see in the R language?
When it comes to data analysis, R has a clear advantage. The tidyverse syntax is easy to understand, even for those unfamiliar with data tables or Pandas-like programming paradigms.
When working with data tables, both base R and Pandas use programming languages that differ significantly from English, which can make understanding them difficult. On the other hand, R Markdown has a notable advantage in that it makes it easy and quick to generate HTML documents. For instance, my former supervisor at C-STAT spent much time creating visually appealing PDF documents because his reports were highly customized. However, if your main goal is to produce polished reports relatively quickly, R Markdown is the better option.
I understand that my main focus is the transition to Quarto. As someone who used to work with R Markdown, I have been learning more about Quarto and adjusting to its features. However, I am concerned about how new users may react to Quarto. I plan to give presentations throughout the year to gauge their responses and better understand any potential issues that may arise.
Moreover, I’ve noticed that many people are unaware of R Markdown’s capabilities. To address this, I conducted an introductory session on R Markdown for a group at the University of Michigan. During my thirty-minute presentation, the participants were surprised by the diverse functionalities of R Markdown, as they were used to working with JavaScript and basic R. Although I had inferior knowledge compared to some of the individuals in the group, my ability to perform certain tasks using R Markdown impressed them.
One of the benefits of R Markdown is its ability to run multiple languages, with each language being executed chunk by chunk. I hope Quarto will also support this feature.
In the past, I have presented on calling R from SAS and SAS from R. During these presentations, I demonstrated how to run a SAS job within an R chunk. However, this approach has a limitation. For it to work, SAS must be accessible from the computer running the R code. This means the SAS installation must be on the computer or a network drive that the computer recognizes as a local drive. On a certain occasion, while using Enterprise Guide on a Linux machine, I faced a problem. I couldn’t locate the executable file (EXE) for SAS from my computer, which obstructed me from executing a SAS job.
It is now possible for individuals to use R Markdown with their preferred programming languages. For instance, R Markdown can be used with Pandas for most cases, which can help individuals produce visually appealing reports quickly. With this approach, all the work can be done within Pandas, and users need only basic knowledge of R. Therefore, Quarto can be seen as a language for report writing only. I will keep an eye on this situation and evaluate its effectiveness.
I want to highlight the smooth combination of Git and GitHub with R. I use GitHub frequently in my work, though I am not very skilled because RStudio IDE fulfills most of my requirements. I rarely face conflicts due to my carelessness; I must interact with Git and GitHub manually.
I highly recommend the book “Happy Git with R” as an essential resource for beginners. This comprehensive guide provides a step-by-step approach to setting up and using Git and GitHub effectively in R.
When using Git in conjunction with R, you can access a detailed transaction history that can be reviewed anytime. I have found this feature incredibly useful and have been able to recover important work using this method. As a data management instructor at MSU, I have also taught my students how to execute this process manually. However, having R Studio automatically handle this task is much more convenient.
In fact, I used SPSS to conduct a project and leveraged GitHub as an experiment. I utilized the data management capabilities of RStudio and found the results satisfactory.
Any techniques you recommend using for planning for or during the event? (Github, zoom, other) Can these techniques be used to make your group more inclusive to people that are unable to attend physical events in the future?
I suggest that RUG organizers should arrange regular monthly meetings. It would be advantageous to fix these meetings on the same day and time every month, as it will help attendees get accustomed to the routine and know when to expect them.
In my years of working with different groups, I have noticed that if we don’t consciously communicate regularly, our communication will become less effective over time. This can lead to a lack of new ideas and engagement, and we may unintentionally exclude potential participants.
For almost 20 years, I have been part of a group that communicated through a university mailing list. However, we faced difficulties as the list was not easily discoverable through search engines like Google. This made it challenging for new individuals to find or contact us. We have taken steps to tackle this problem by introducing Meetup as a new tool that can be used alongside or instead of our traditional mailing list. The main benefit of Meetup is that it is easily searchable on Google, which makes it simple for anyone to locate and get in touch with our group.
I want to emphasize the importance of effective communication. Neglecting communication efforts can cause a decline in communication quality. I have personally witnessed this happening in different groups, and I have seen others experiencing similar challenges.
How do I Join?
R Consortium’s R User Group and Small Conference Support Program (RUGS) provides grants to help R groups organize, share information, and support each other worldwide. We have given grants over the past four years, encompassing over 65,000 members in 35 countries. We would like to include you! Cash grants and meetup.com accounts are awarded based on the intended use of the funds and the amount of money available to distribute.
Dive into the world of validation at the first R Validation Hub community meeting of the year! What defines a validated R package? Is it ensuring reproducibility across systems? Prioritizing bug-free and well-maintained packages? We want to hear YOUR take!
This is your chance to share your perspective, learn from diverse viewpoints, and help shape the future of validation in the R ecosystem. Whether you’re a developer, user, or enthusiast, your insights are valuable.
Let’s Discuss
What does validation mean in the R world to you? Join us to debate, learn, and network. Mark your calendars and prepare to contribute to shaping the standards of R package validation.
The R Consortium is excited to announce the opening of our call for proposals for the 2024 Infrastructure Steering Committee (ISC) Grant Program on March 1st, 2024. This initiative is a cornerstone of our commitment to bolstering and enhancing the R Ecosystem. We fund projects contributing to the R community’s technical and social infrastructures.
Enhancing the R Ecosystem: Technical and Social Infrastructures
Our past funding endeavors have spanned a variety of projects, illustrating our dedication to comprehensive ecosystem support:
Technical Infrastructure: Examples include R-hub, a centralized tool for R package checking, enhancements in popular packages like mapview and sf, and ongoing infrastructural development for R on Windows and macOS.
Social Infrastructure: Initiatives such as SatRDays, which facilitates local R conferences, and projects for data-driven tracking of R Consortium activities.
Focused Funding Areas
The ISC is particularly interested in projects that align with technical or software development that aids social infrastructure. It’s important to note that conferences, training sessions, and user groups are supported through the RUGS program, not the ISC grants.
Ideal ISC Projects
We look for proposals that:
Have a broad impact on the R community.
Possess a clear, focused scope. Larger projects should be broken down into manageable stages.
Represent low-to-medium risk and reward. High-risk, high-reward projects are generally not within our funding scope.
Projects unlikely to receive funding are those that:
Only impact a small segment of the R community.
Seek sponsorship for conferences, workshops, or meetups.
Are highly exploratory.
Important Dates
First Grant Cycle: Opens March 1, 2024, and closes April 1, 2024.
Second Grant Cycle: Opens September 1, 2024, and closes October 1, 2024.
You can learn more about submitting a proposal here.
We eagerly await your proposals and are excited to see how your ideas will propel the R community forward. Let’s build R together!
The R Consortium recently connected with Kylie Bemis, assistant teaching professor at the Khoury College of Computer Sciences at Northeastern University. She has a keen interest in statistical computing frameworks and techniques for analyzing intricate data, particularly focusing on datasets with complex correlation patterns or those that amalgamate data from various origins.
Kylie created matter, an R package that offers adaptable data structures suitable for in-memory computing on both dense and sparse arrays, incorporating multiple features tailored for processing nonuniform signals, including mass spectra and various other types of spectral data. Recently, Kylie upgraded matter to version 2.4. Since our May 2023 discussion, Kylie has enhanced its signal processing capabilities, focusing on analytical tools like principal component analysis and dimension reduction algorithms, which are crucial for imaging and spectral data. A grant from the R Consortium supports this project.
We talked with you about matter in May 2023. You were providing support for matter and looking to improve the handling of larger data sets and sparse non-uniform signals. matter has been updated to version 2.4. What’s new?
Last time we spoke, I had already rewritten most of the matter infrastructure in C++ for better maintainability. Since then, my focus has been on enhancing our signal processing capabilities. This summer, I’ve been adding essential signal processing functions and basic analytical tools, which are particularly useful in fields dealing with spectra or various types of signals.
I’ve incorporated fundamental techniques like principal component analysis, non-negative matrix factorization, and partial least squares. I’ve also added several dimension reduction algorithms and a range of signal processing tools for both 1D and 2D signals. This includes smoothing algorithms for images and 1D signals and warping tools applicable to both.
These enhancements are crucial for working with imaging and spectral data and include features like distance calculation and nearest neighbor search.
My aim has been to augment matter with robust signal processing tools, particularly for sparse and non-uniform signals. This is inspired by my experience in augmented reality (AR) and my desire to integrate tools similar to MATLAB’s Signal Processing Toolbox or SciPy in Python. As someone primarily analyzing mass spectrometry imaging data, I found these tools initially in my Cardinal package. I wanted to transfer them to a more appropriate platform, not specific to mass imaging, and reduce Cardinal’s reliance on compiled native code for easier version updates.
Additionally, I’ve been building a more robust testing infrastructure for these tools and documenting them thoroughly, including citations for the algorithms I used for key picking and smoothing techniques. This documentation details the implementation of various algorithms, such as guided filtering and nonlinear diffusion smoothing, citing the sources of these algorithms.
By providing support for non-uniform signal data, matter provides a back end to mass spectrometry imaging data. But working with large files is applicable in a lot of domains. What are some examples?
I deal with large files and data sets across various fields. Matter can be particularly impactful in areas dealing with signal, spectral, or imaging data. One field that comes to mind is remote sensing, where the imaging tools I’ve incorporated would be highly beneficial. That’s one key application area.
Another field is biomedical imaging, especially MRI data. For instance, a data format we often use for mass spectrometry imaging was originally developed for MRI – it’s called Analyze, and there’s a more recent variant known as NIfTI. This format is also supported in Cardinal for mass spec imaging data, but it’s primarily used in MRI and fMRI data analysis. While matter doesn’t directly offer plug-and-play functionality for MRI data, with some modifications, it could certainly be adapted for importing and processing MRI data stored in these formats.
We don’t have a specific function to read NIfTI files directly, but the structure of these files is quite similar to the mass imaging files we commonly work with. They consist of a binary file organized in a particular format, with a header that functions like a C or C++ struct, indicating where different image slices are stored. Understanding and interpreting this header, which is well-documented elsewhere, is key.
So, with some effort to read and attach the header file correctly, it’s entirely feasible to build a function for reading and importing MRI data. We’ve already done something similar with the Analyze format. Someone could definitely examine our approach and develop a method to handle MRI data effectively.
Previously, you indicated you wanted to improve R data frames and string support. You have a prototype data frame in the package already? What’s the schedule for improvements?
I’m currently evaluating how far we’ll expand certain features in our project. One of these features is supporting strings, which is already implemented. Regarding data frames, I believe there might be better solutions out there, but it’s quite simple to integrate our data with them. For instance, taking a vector or an array, whether a matter matrix or a matter vector, and inserting it into a data frame column works well, particularly with Bioconductor data frames.
I’m not entirely convinced that developing standalone, specialized data frame support in matter is necessary. It seems that other platforms, especially those like Bioconductor, are already making significant advancements in this area. For now, it seems sufficient that users can easily incorporate a matter vector or array into a data frame column. I’m hesitant to duplicate efforts or create overlapping functionalities with what’s already being done in this field.
What’s the best way for someone to try matter? How should someone get started?
Like any Bioconductor package, we offer a vignette on the Bioconductor website. This vignette provides a basic guide on how to start using our package, including creating matrices and arrays. It shows how these can serve as building blocks to construct larger matrices, arrays, and vectors. This is a straightforward way for users to begin.
Regarding the applicability of our package, it really depends on the specific data needs of the user. For instance, our package provides out-of-memory matrices and arrays. If that’s the primary requirement, then our package is certainly suitable. However, there are other packages, both in Bioconductor, like HDF5 array support, and on CRAN, such as big memory and FF, that also offer similar functionalities.
The real advantage of our package becomes apparent when dealing with specific data types. If you’re working with data formats like MRI, where you have a binary file and a clear understanding of its format, our package can be very helpful. It simplifies attaching different parts of the file to an R data structure.
Moreover, if your work involves signal data, particularly non-uniform signals like those in mass spectrometry or imaging data, our package becomes even more beneficial. Over the summer, I’ve added extensive support for preprocessing, dimension reduction, and other processes that are crucial for handling these types of data. So, in these scenarios, our package can be a valuable tool.
Anything else you would like to share about matter 2.0?
I’ve spent much of the summer working on improvements to the matter package, and it’s now in a good place, particularly regarding signal processing capabilities. These enhancements are largely aligned with the needs of mass spectrometry, an area I closely focus on. As new requirements emerge in mass spectrometry, I’ll look to add relevant features to matter, particularly in signal and image processing.
However, my current priority is updating the Cardinal package to support all these recent changes in matter. Ensuring that Cardinal is fully compatible with the new functionalities in matter is my next major goal, and I’m eager to get started on this as soon as possible.
About ISC Funded Projects
A major goal of the R Consortium is to strengthen and improve the infrastructure supporting the R Ecosystem. We seek to accomplish this by funding projects that will improve both technical infrastructure and social infrastructure.
Are you passionate about financial economics and eager to learn more about empirical research methods? Then our upcoming webinar is an unmissable opportunity for you!
Discover Tidy Finance: A Revolutionary Approach in Financial Economics
Tidy Finance isn’t just a method; it’s a movement in financial economics. This webinar will introduce you to this innovative approach, which is grounded in the principles of transparency and reproducibility. With a focus on open source code in both R and Python, Tidy Finance is changing the game for students and instructors alike. You’ll learn about its applications in empirical research and how it’s reshaping the way we teach and learn in the financial domain.
What You’ll Learn
Introduction to Tidy Finance (10 mins): Get an overview of Tidy Finance principles and its significance in the field of financial economics.
Accessing and Managing Financial Data (20 mins): Dive into the practical aspects of using R to import, organize, and manage various data sets.
WRDS & Other Data Providers (10 mins): Explore different data providers, including open source and proprietary options.
Q&A Session (15 mins): Have your queries addressed directly by Christoph in an interactive Q&A session.
Who Should Attend?
This webinar is tailored for students, professionals, and anyone with an interest in financial economics, data management, and empirical research. Whether you’re just starting or looking to deepen your understanding, this webinar will provide valuable insights and practical knowledge.
Register now to secure your spot in this enlightening session. Embrace the opportunity to learn from a leading expert and elevate your understanding of Tidy Finance and financial data management.
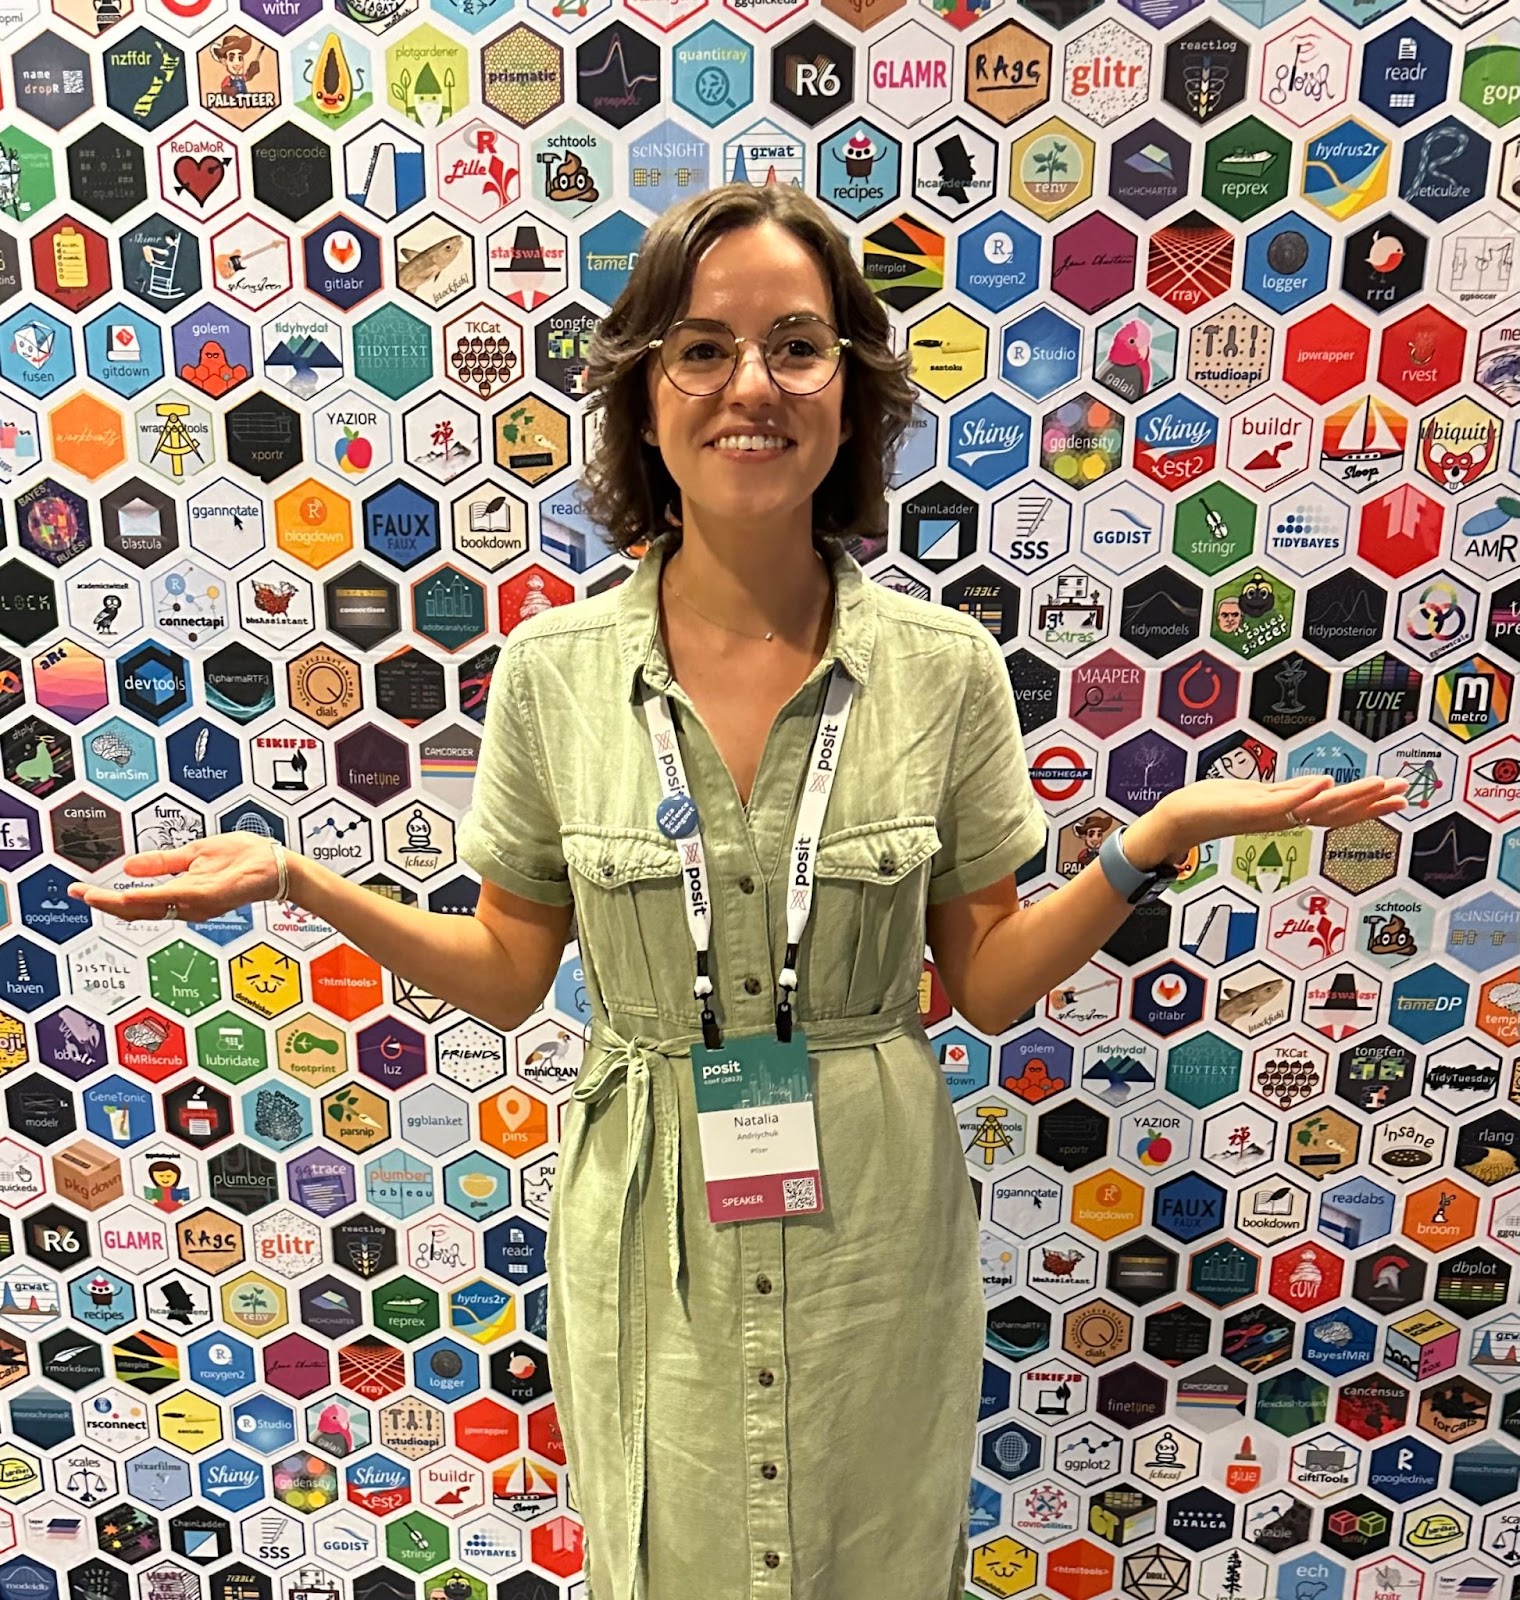
The R Consortium recently talked with Natalia Andriychuk, Statistical Data Scientist at Pfizer and co-founder of the RTP R User Group (Research Triangle Park in Raleigh, North Carolina), to get details about her experience supporting the Pfizer R community and starting a local R user group.
She started her R journey over 7 years ago, and since then, she has been passionate about open source development. She is a member of the Interactive Safety Graphics Task Force within the American Statistical Association Biopharmaceutical Safety Working Group, which is developing graphical tools for the drug safety community.
Natalia Andriychuk at posit:conf 2023
Please share your background and involvement with the R community at Pfizer and beyond.
From 2015 to 2022, I worked at a CRO (Contract Research Organization) in various roles, where I discovered my passion for Data Science after being introduced to R, JavaScript, and D3 by my talented colleagues. I became a part of an amazing team where I learned valuable skills.
Later, when I began looking for new career opportunities, I knew that I wanted to focus on R. I sought a role that would deepen my R skills and further advance my R knowledge. This is how I came to join Pfizer in 2022 and became a part of the amazing team. I am a Statistical Data Scientist in the R Center of Excellence SWAT (Scientific Workflows and Analytic Tools) team.
Pfizer SWAT team at posit::conf2023 (left to right: Natalia Andriychuk, Mike K Smith, Sam Parmar, James Kim)
The R Center of Excellence (CoE) supports various business lines at Pfizer. We provide technical expertise, develop training on R and associated tools, promote best practices, and build a community of R users within Pfizer. Our community currently consists of over 1,200 members.
I will present Pfizer’s R CoE progress and initiatives during the R Consortium R Adoption Series Webinar on February 8th at 3:00 pm EST.
My first introduction to the R community was through the posit::conf (previously known as rstudio::conf) in 2018. Attending the conference allowed me to witness the welcoming nature of the R community. Five years later, in 2023, I made it to the speakers’ list and presented at the posit::conf 2023. It was an incredible experience!
I also follow several other avenues to connect with R community members. As the name suggests, I read R Weekly weekly and attend the Data Science Hangout led by Rachael Dempsey at Posit. Every Thursday, Rachael invites a data science community leader to be a featured guest and share their unique experiences with the audience. Fortunately, I was invited as a featured guest to one of the Posit Data Science Hangouts. I shared my experience organizing and hosting an internal R at Pfizer Hangout.
Can you share your experience of starting the RTP (Research Triangle Park) R User Group?
Nicholas Masel and I co-organize the RTP R User Group in our area. We formed the RTP R User Group in 2023 and have held three meetings: meet-and-greet, social hour, and a posit::conf 2023 watch party.
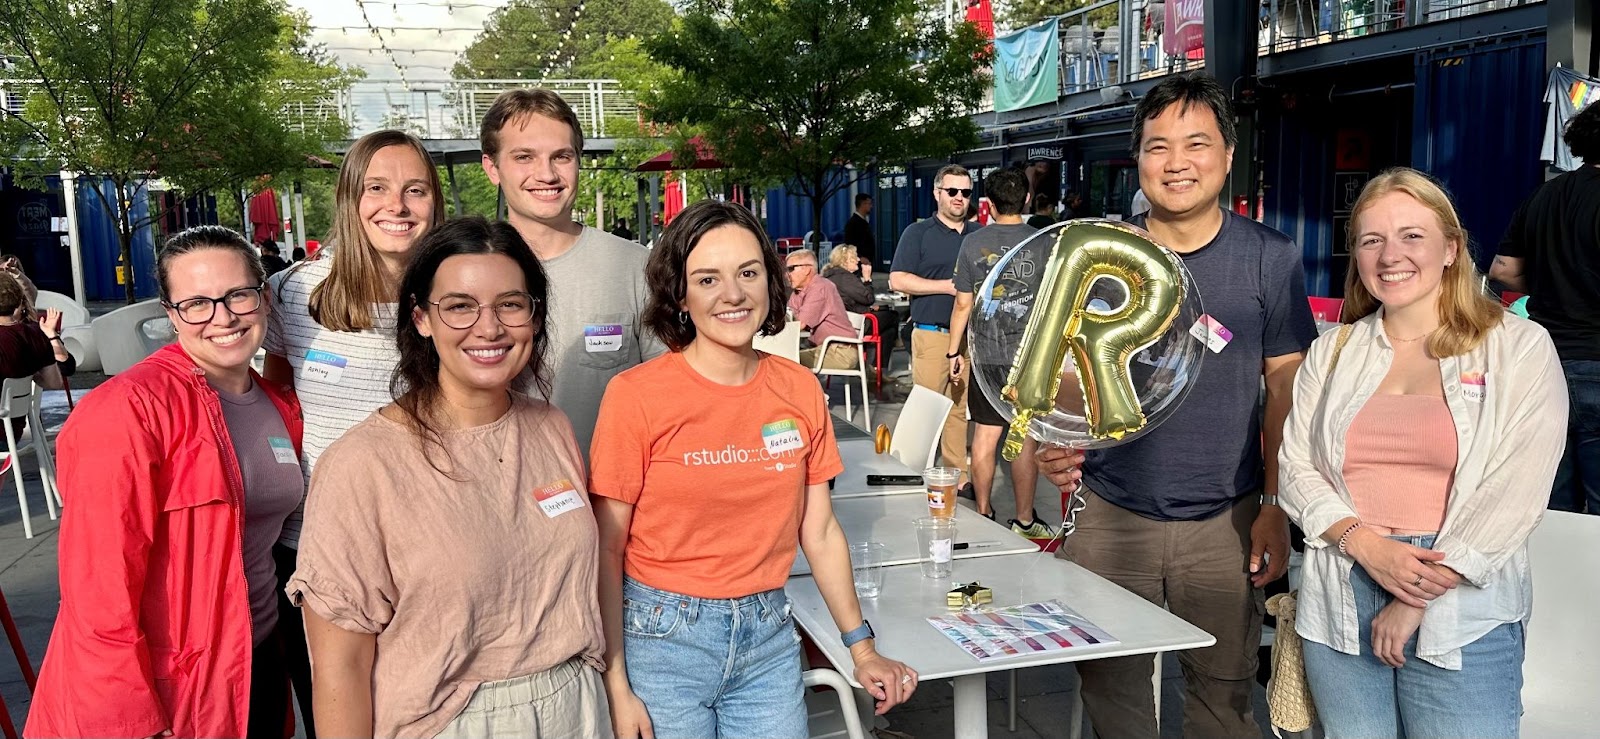
RTP R User Group Social Hour Gathering.
We hope to expand and increase attendance at our meetups in 2024. We currently have approximately 74 members who joined the online meetup group, and we look forward to meeting all of them in person moving forward.
Can you share what the R community is like in the RTP area?
Nicholas and I both work in the pharmaceutical industry, and thus far, our in-person user group meetings have predominantly included individuals from this field. However, we want to emphasize that our user group is open to everyone, regardless of industry or background.
The RTP area has great potential for a thriving R User Group. We are surrounded by three major universities (University of North Carolina at Chapel Hill, Duke University, and North Carolina State University), the growing high-technology community and a notable concentration of life science companies. We anticipate attracting more students in the coming year, especially those studying biostatistics or statistics and using R in their coursework. We also look forward to welcoming individuals from various industries and backgrounds to foster a rich and collaborative R user community.
Please share about a project you are working on or have worked on using the R language. Goal/reason, result, anything interesting, especially related to the industry you work in?
I am an open source development advocate, believing in the transformative power of collaborative innovation and knowledge sharing. I am a member of the Interactive Safety Graphics (ISG) Task Force, part of the American Statistical Association Biopharmaceutical Safety Working Group. The group comprises volunteers from the pharmaceutical industry, regulatory agencies, and academia to develop creative and innovative interactive graphical tools following the open source paradigm. Our task force is developing a collection of R packages for clinical trial safety evaluation. The {safetyGraphics} package we developed provides an easy-to-use shiny interface for creating shareable safety graphics for any clinical study.
{safetyGraphics} supports multiple chart typesincluding web-based interactive graphics using {htmlwidgets}
R Consortium’s R User Group and Small Conference Support Program (RUGS) provides grants to help R groups organize, share information, and support each other worldwide. We have given grants over the past four years, encompassing over 65,000 members in 35 countries. We would like to include you! Cash grants and meetup.com accounts are awarded based on the intended use of the funds and the amount of money available to distribute.
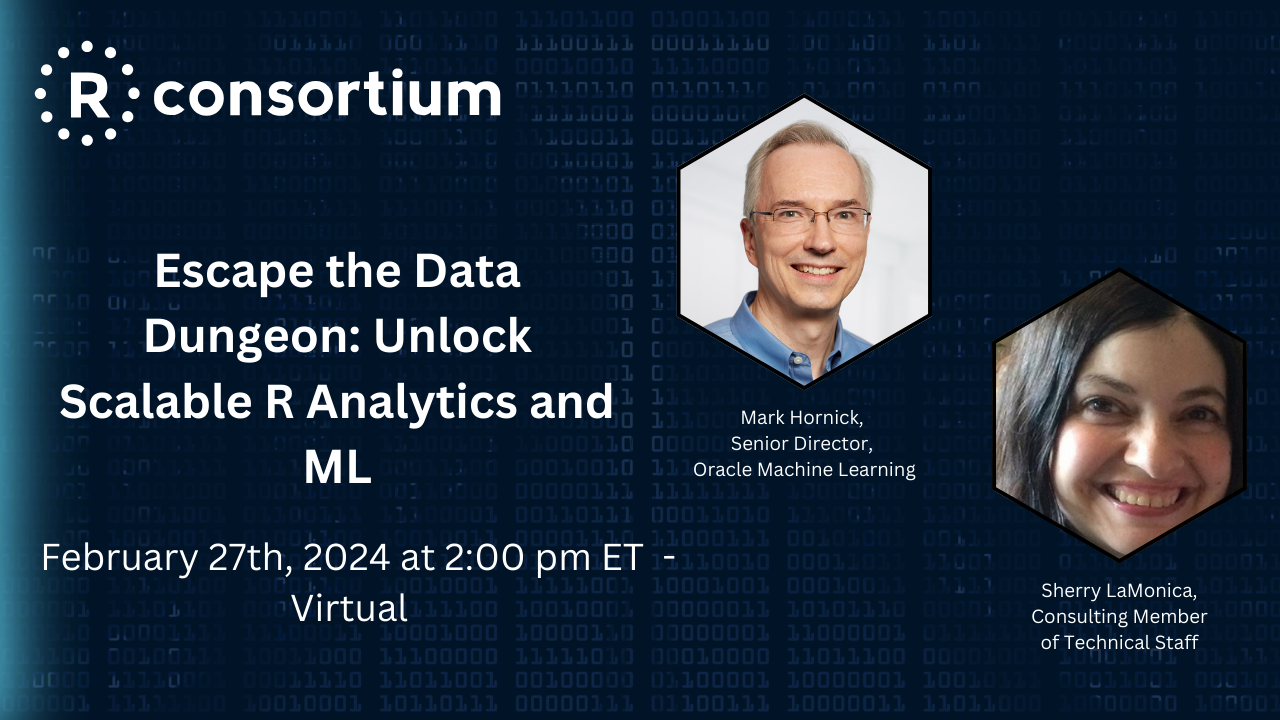
Are you seeking faster R data processing and enhanced machine learning capabilities for massive datasets in databases? Look no further. Join us in our upcoming webinar to discover how Oracle Machine Learning for R (OML4R) can transform your data analysis and machine learning endeavors.
Webinar Highlights:
Seamless In-Database Access: Engage directly with your data, eliminating the need for time-consuming extractions.
High-Performance Data Processing: Tackle massive datasets with unmatched ease and efficiency.
Integrated Machine Learning: Develop and deploy powerful models within your database, streamlining your data science workflow.
Simplified Production Deployment: Transition your R scripts to production effortlessly, making your projects more impactful.
We’ll also demonstrate real-world applications, including product bundling, demand forecasting, and customer churn prediction, showcasing OML4R’s potential to revolutionize your R workflows.
Don’t Miss Out!
Elevate your data science skills and streamline your processes. Register now for our webinar and unlock the full potential of in-database analytics with OML4R. Take your R to the next level.
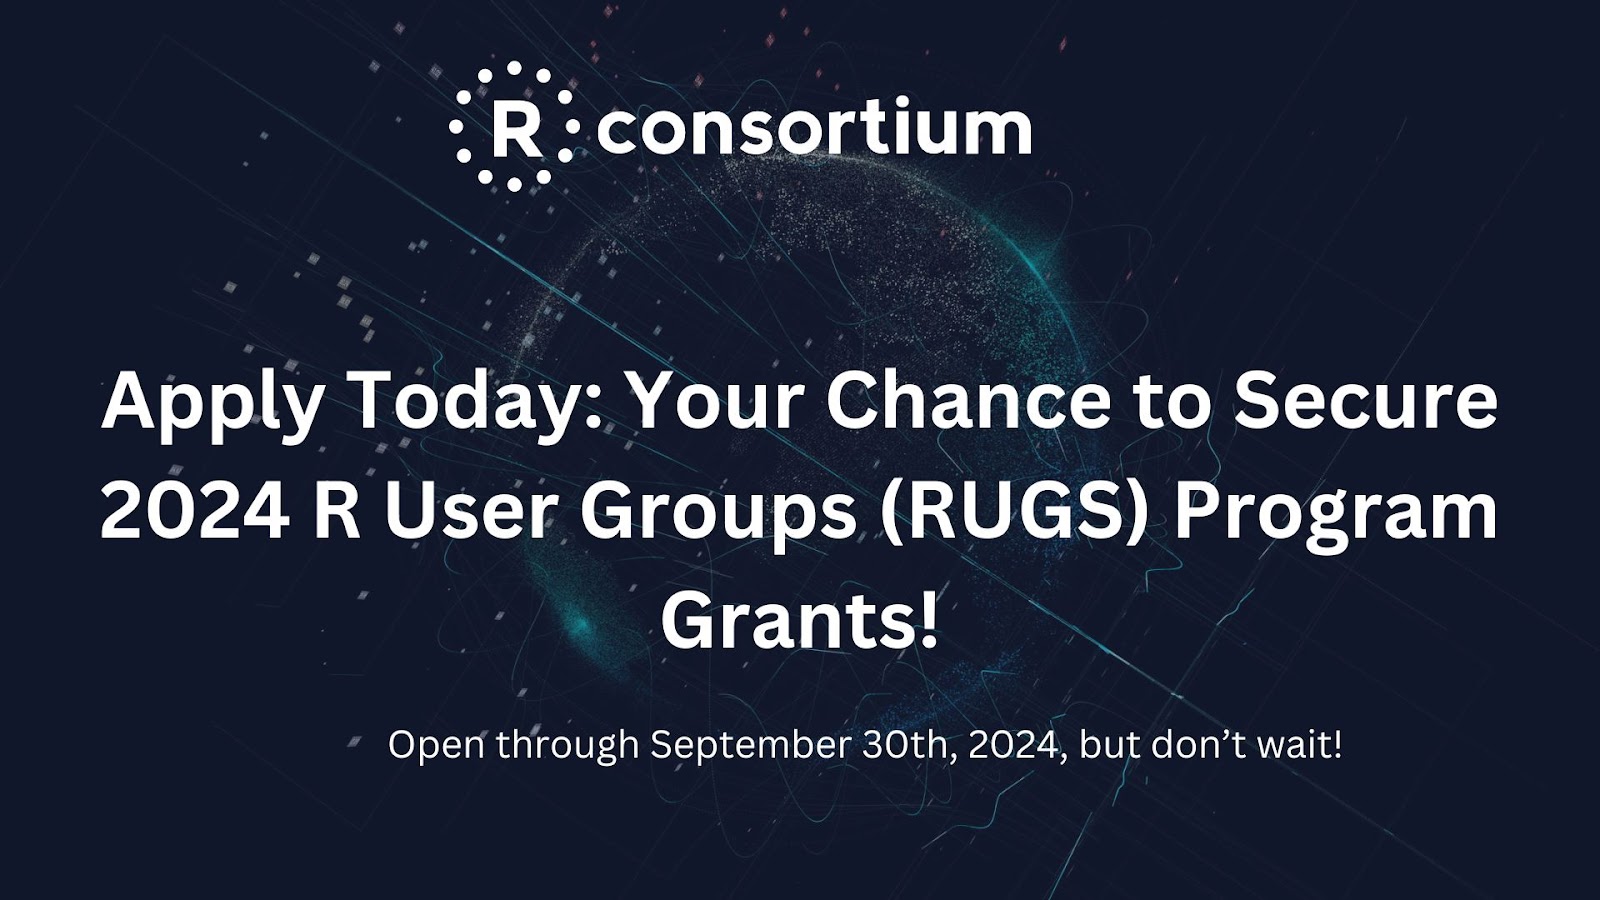
Quick update on the 2024 R User Groups (RUGS) Program. The review of the first batch of grants is in progress, marking the beginning of the awarding phase. But there’s still plenty of time for you to apply!
Interested in building up your own R User Group and creating a strong R community where you live? R Consortium would like to help!
User Group Grants: Support for enhancing user engagement and user-centric initiatives.
Conference Grants: For organizing or attending events aligned with R Consortium goals.
Special Projects Grants: For groundbreaking ideas needing an initial push.
For details and to apply, visit here. Your participation is pivotal for the growth of the R language.
R User Groups: Strengthening Global Connections
With 74 active groups and over 67,000 members, R communities are a melting pot of knowledge and innovation. Discover what other RUGS organizers are doing and how they have solved tough problems restarting in person meetings or finding good locations or communicating effectively with their community… on our blog. Many RUGS case studies are available.
Key Dates:
Application Period: Open through September 30th, 2024, but don’t wait!
Note: Grants are not for software development or technical projects. For those, consider the ISC Grant Program. Learn more here.
Join us in building the worldwide R community. Apply now and be part of the journey!
Last year, Antonio Hegar of the R Glasgow user group shared the challenges of organizing an R user group in Glasgow. The group now regularly hosts events, attracting local R users and experts. Antonio shared with the R Consortium the group’s journey and anecdotes that have helped it to build momentum. He also shared his hopes for maintaining this momentum, with speakers lined up for the next three events.
Antonio also discussed his work with R for his PhD research in data analysis for healthcare. He spoke about the ever-evolving nature of R and some of the new developments that have been useful for his research.
What’s new with the Glasgow R User Group since we last talked?
As we discussed the last time, one of the most pressing issues we faced as a local R user group was our lack of engagement with the community. This is particularly interesting given that both Glasgow and Edinburgh have their own R user groups. Both cities are only an hour apart, yet we weren’t seeing the same level of engagement as other groups in the UK.
To address this issue, we have been strategizing and holding several meetings. To summarize, we discussed improving our marketing and engagement with our audience. We also decided to hold one final meeting at the end of the year.
Besides our internal meetings, we also hosted two R events. One of the group’s founders, Andrew Baxter, a postgraduate researcher at the University of Glasgow, has been instrumental in organizing these events. Because he works at the University of Glasgow, he has access to many resources, including physical venues and fellow academics, and this has been a major plus in facilitating our engagement.
Previously, I had been trying to do what other groups have done: finding random venues and hosting events there. However, this was not as effective as we had hoped.
From the discussions that we had, as well as listening to our audience, we learned that people who are interested in working with R have very specific wants and needs. If these needs are not being met, then it is unlikely that people will be attracted to the group, and as such, we had to reframe our approach to attracting people.
We recognized it is key to have a specific venue. We now hold the vast majority of our meetings at the University of Glasgow. This seems to be very appealing to people, as they enjoy the academic setting. Furthermore, the University of Glasgow is well known and respected, not just in Scotland but across the world, and this adds weight to the appeal, and the reputation helps to draw people in.
The second thing that proved essential was consistency. Having a meeting for one month and then having a gap breaks the flow, and sends the wrong message to your audience. When people see that you are committed to what you want to do, they respond to that and are more likely to be engaged in the community.
We had a final meeting in December, and Andrew Baxter contacted Mike Smith, one of the local R Consortium representatives. He is based in Dublin, Ireland, but frequently travels back and forth to Scotland. He leveraged this network to recommend speakers and topics for the conference. This was particularly helpful in attracting people from industry, who are often interested in the latest developments in R. Mike has been a tremendous asset to the group since our meeting in December.
A venue, people on the inside of the industry, and a consistent schedule have been the three key components. Three speakers have been lined up for early 2024: one for January, February, and March.
We will not have much difficulty finding additional speakers based on the academic and industrial contacts. At most, we must determine who will speak on which topic and when they will be available, which is not difficult. Based on the current situation, it does not appear that we will have any trouble maintaining momentum and keeping the meetings going.
What industry are you currently in?
I am a PhD student at Glasgow Caledonian University. My PhD research focuses on data science applied to health, specifically using machine learning to predict disease outcomes.
I am interested in understanding why some people who experience an acute illness, such as COVID-19, develop long-term health problems. In some countries, up to 10% of people who contract COVID-19 never fully recover. These individuals may experience permanent shortness of breath, headaches, brain fog, joint pain, and other symptoms.
I am currently researching how data science can be used to answer questions such as these, using large data sets from, for example, the NHS. R is the primary tool used for this research.
When we last spoke, I was in the second year of my PhD. I am now in my third and final year. I should be submitting my dissertation before the end of this year. Balancing my commitments to R, my PhD work, and other activities is challenging, but I managed to pull it off.
How do you use R for your work?
I extensively use R. One of R’s most beneficial aspects is that it’s constantly evolving and expanding. As a result, it is impossible to master everything. You do not master R; rather, you master certain R areas relevant to your research or area of expertise. In my research, I found several medical statistics and biostatistics packages extremely useful. I was aware of a few of them but unaware of how many there were.
For instance, consider the following brief instance of a task that I began working on yesterday. In the context of medical data, particularly when analyzing health conditions, it is common for individuals to have multiple health conditions that are often linked. This often makes it more difficult for doctors to treat and for individuals to recover fully.
If I were to apply classical statistics using base R, this would be very time-consuming. However, I recently discovered that there are also medical statistical packages specifically designed for analyzing data for individuals with comorbidities. For example, if I wanted to analyze individuals suffering from diabetes, hypertension, cancer, obesity, or a combination of different diseases, I could do so using these packages.
In addition, it is possible to create a score that can be used to estimate the likelihood of a person who becomes ill and goes to the hospital, stays for a long time, or dies. It is possible to perform this task using regular statistics and programming in R, but it would be very tedious. In my case, I am working on a tight deadline and need to submit my work by a specific date. I believe the package I am speaking of is the comorbidity package in R. It was developed recently by researchers at the London School of Hygiene & Tropical Medicine and is an invaluable tool.
I work with NHS data through a third-party organization that controls it and allows me access to it. Last year in December, they provided me with brief training and taught me how to access their data on a DBS SQL server using SQL queries embedded in R code.
Learning about very niche packages, which are very content-specific or topic-specific, is very useful for researchers like myself. Integrating different programming languages is also useful because they are all merging into one. Python, Julia, R, and Java have a lot of cross-fertilization and use between the different programming and software development packages. If R continues to streamline its services to integrate other packages, it will be a win-win situation for everyone.
What is the R Community like in Glasgow? What efforts are you putting in to keep your group inclusive for all participants?
We are not trying to cater to one specific level of expertise. The last meeting had a good mix of participants, including PhD students, undergraduates, people who have worked in finance and tech, software developers, and an individual from the R Consortium in Dublin, Ireland.
The group is open to everyone, and we are trying to mix participants with different needs, wants, and interests. It is understood that attendees will choose which events they would like to attend. Certain events will focus more on entry-level individuals beginning their R learning journey. For example, they are interested in learning what they can do with ggplotand the tidyverse.
Mid-level individuals, including graduate students, will also be targeted. A portion of these students are novices, but many are more experienced. They have a strong foundation in R and RStudio or Posit. However, they are now seeking to learn more advanced techniques, such as how to perform specific calculations. For instance, they may be working with quantitative or qualitative data and are now at the analysis stage of their research and wonder what to do next.
Finally, there are a small number of highly experienced programmers who are interested in learning more about integrating specific features into a package. They may want to know how to create their packages and launch them. They are also interested in learning about Shiny and Quarto and how they can use these tools for their businesses or companies.
Most individuals fall into the beginner or intermediate levels, but there are a few who are highly advanced and still interested in attending. As a result, most of the talks will be geared toward individuals with intermediate-level experience. This will ensure that the material is not too advanced for beginners but also not too basic for advanced learners.
Can you tell us about a recent event that received a good response from the audience?
Of the recent events that were particularly successful, I would like to highlight the one held in November last year. It was titled “Flex Dashboard: Displaying data with high impact using minimal code.” Erik Igelström, a researcher from the University of Glasgow, presented his use of R Shiny to display data from the Scottish government. The presentation was highly informative and demonstrated the potential of Shiny to present data in a user-friendly manner.
The meeting was attended by a representative from R Software in Ireland, who provided us with a wealth of information about industry developments, including the latest trends and upcoming projects. As a result of this meeting, 2023 was the most productive year for our R meetup.
The preceding meetups were not entirely unproductive, but the most recent one, held in November last year, laid the groundwork for the current initiatives.
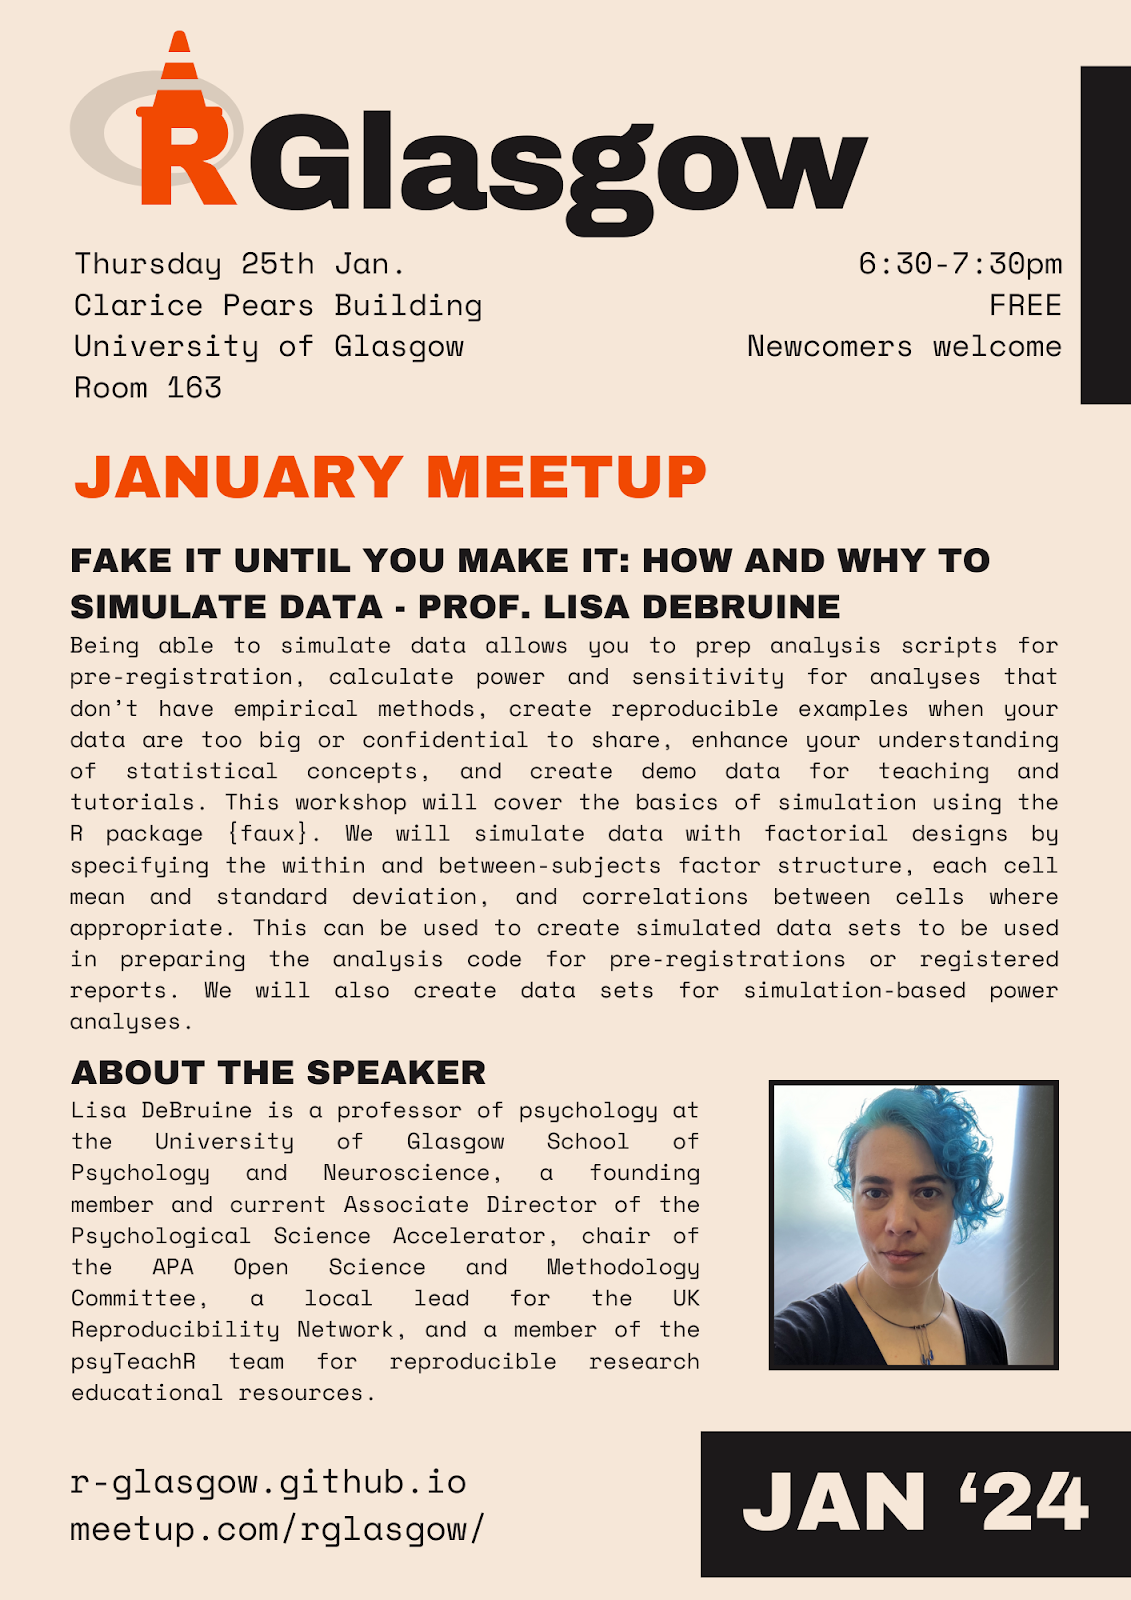
Professor Lisa DeBruine will be presenting at this Meetup. She is a professor of psychology at the University of Glasgow in the School of Psychology and Neuroscience. She is a member of the UK Reproducibility Network and works in PsyTeachR. She has used the psych package extensively and many other good packages in R to conduct her psychological research. Her presentation will be on how to simulate data to prepare analyses for pre-registration.
As those who work with data know, it is sometimes counterproductive to work directly with the data itself. For example, if one is building a model, it is not advisable to use all of the data to build the model, especially if the data set is small. This is because there is a risk of over-fitting.
Generating dummy data for quantitative data is a well-known technique. However, generating dummy data for qualitative data is rare. This is because qualitative data is often unstructured and difficult to quantify. Professor Lisa DeBruine is an expert in generating dummy data for qualitative data.
SPSS is a popular statistical software package used by sociologists, anthropologists, and psychologists. However, R is a more powerful and flexible tool that can perform a wider range of analyses. Learning to use R and the psych package can greatly simplify the process of conducting factor analysis. Additionally, R can be used to perform calculations and analyses that are impossible in SPSS.
Our team is highly capable, and we have another team member who is particularly skilled in generating graphics and designing flyers. He has been responsible for creating the promotional material and has done an excellent job.