Dr. Ayubu Anapapa Okango with the Department of Mathematics and Actuarial Science at the Murang’a University of Technology, in Murang’a, Nigeria, and Timothy A. Ogunleye, lecturer with the Department of Statistics at Osun State University, in Osogbo, Nigeria, will be hosting and facilitating the webinar.
Two-Way ANOVA Randomized Complete Block Designs without interactions
Randomized Complete Block Designs with interactions – Factorial Experiment
Post-Hoc Analysis of all these scenarios
This webinar is aimed to help those studying R to better understand the design and analysis of experiments using R syntax as well as using R to better respond to a variety of problems that can arise.
Join Dr. Ayubu Anapapa Okango and Timothy A. Ogunleye on Aug 29, 2022 from 11am-1pm (WAT) / 1pm-3pm (EAT). Register now!
The next Francophone SatRday Conference will be Saturday, August 6, at 9 am UTC, and will cover Using R for Data Science and Epidemiology. Join experts Ehouman Evans, Marie Ruth DAGO (Intro to R), Aminata Ndiaye (R in Epidemiology), Bryan Tegomoh, and Khalid Lemzouji to better understand how to use applications using the R Language for data science, epidemiology, and more. The event will be held in French.
SatRdays are R-focused conferences that are held on Saturdays. They happen all over the globe and are organized by local community leaders to help and grow the local community. There is a big emphasis on making these events accessible – by not requiring time off work, by not costing more than a day’s wages, by being supportive of new community members or leaders.
Announcing R/Medicine 2022! The conference will be fully virtual from August 23 through 26 and feature two days of workshops (included with the low registration fee!) and two days of keynotes featuring JJ Allaire and Frank Harrell.
R / Medicine is the premier conference for the use of R in clinical practice and reflects the increasing importance of data science and machine learning to the everyday lives of physicians and other healthcare professionals. Topics include working with clinical data, statistical modeling, forecasting, reproducible research, clinical reporting, R package development and more. Check out some highlights from previous conferences on our YouTube channel!
Early Bird Registration is now open so sign up for the conference now! We are accepting proposals for 30 minute talks, 30 minute panel discussions, and 10 minute lighting talks.
Interested in sponsoring R/Medicine? Please take a look at our sponsorship brochure.
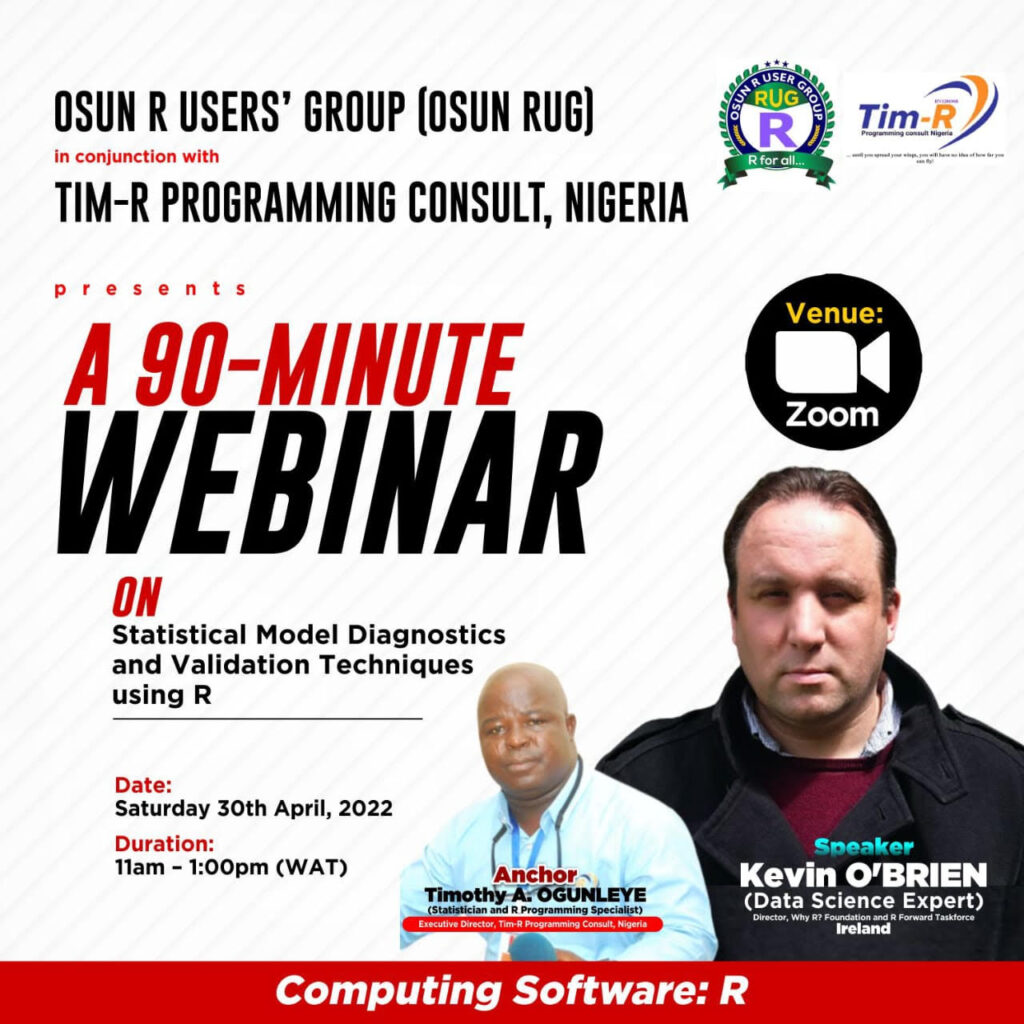
Organized by the OSUN R USERS GROUP, Nigeria, and coordinated by Timothy A. OGUNLEYE. Speaker Kevin O’Brien is an active contributor of the R Consortium’s Inclusion, Diversity, Equity, and Accessibility (IDEA) Working Group. The R-Community IDEA is a top level project of the R-Consortium with the goal of broadly considering how the R Consortium can best encourage and support diversity and inclusion across a variety of events and platforms. This includes Code of Conduct development, speaker support, and connecting with the global R-User community. If you’d like to learn more or get involved, please join our monthly public meeting.
Model validation is a vital part of the statistical modeling process, but is often overlooked in statistical courses. This process allows the analyst to properly validate the assumptions underlying the model, once applied to the data.
In this presentation, we will look at residual analysis and influence measures for linear models, with some associated topics. The talk is aimed at students and early career data professionals who have already encountered conventional regression analyses, and are familiar with the model fitting process in R (i.e. the ‘’lm()’’ function).
The talk will introduce a mixture of graphical procedures, statistical measures and hypothesis tests, which the attendees are invited to learn more about beyond the talk. The talk will feature the {CAR} R package, but all of the other functionality is available in Base R or Tidyverse.
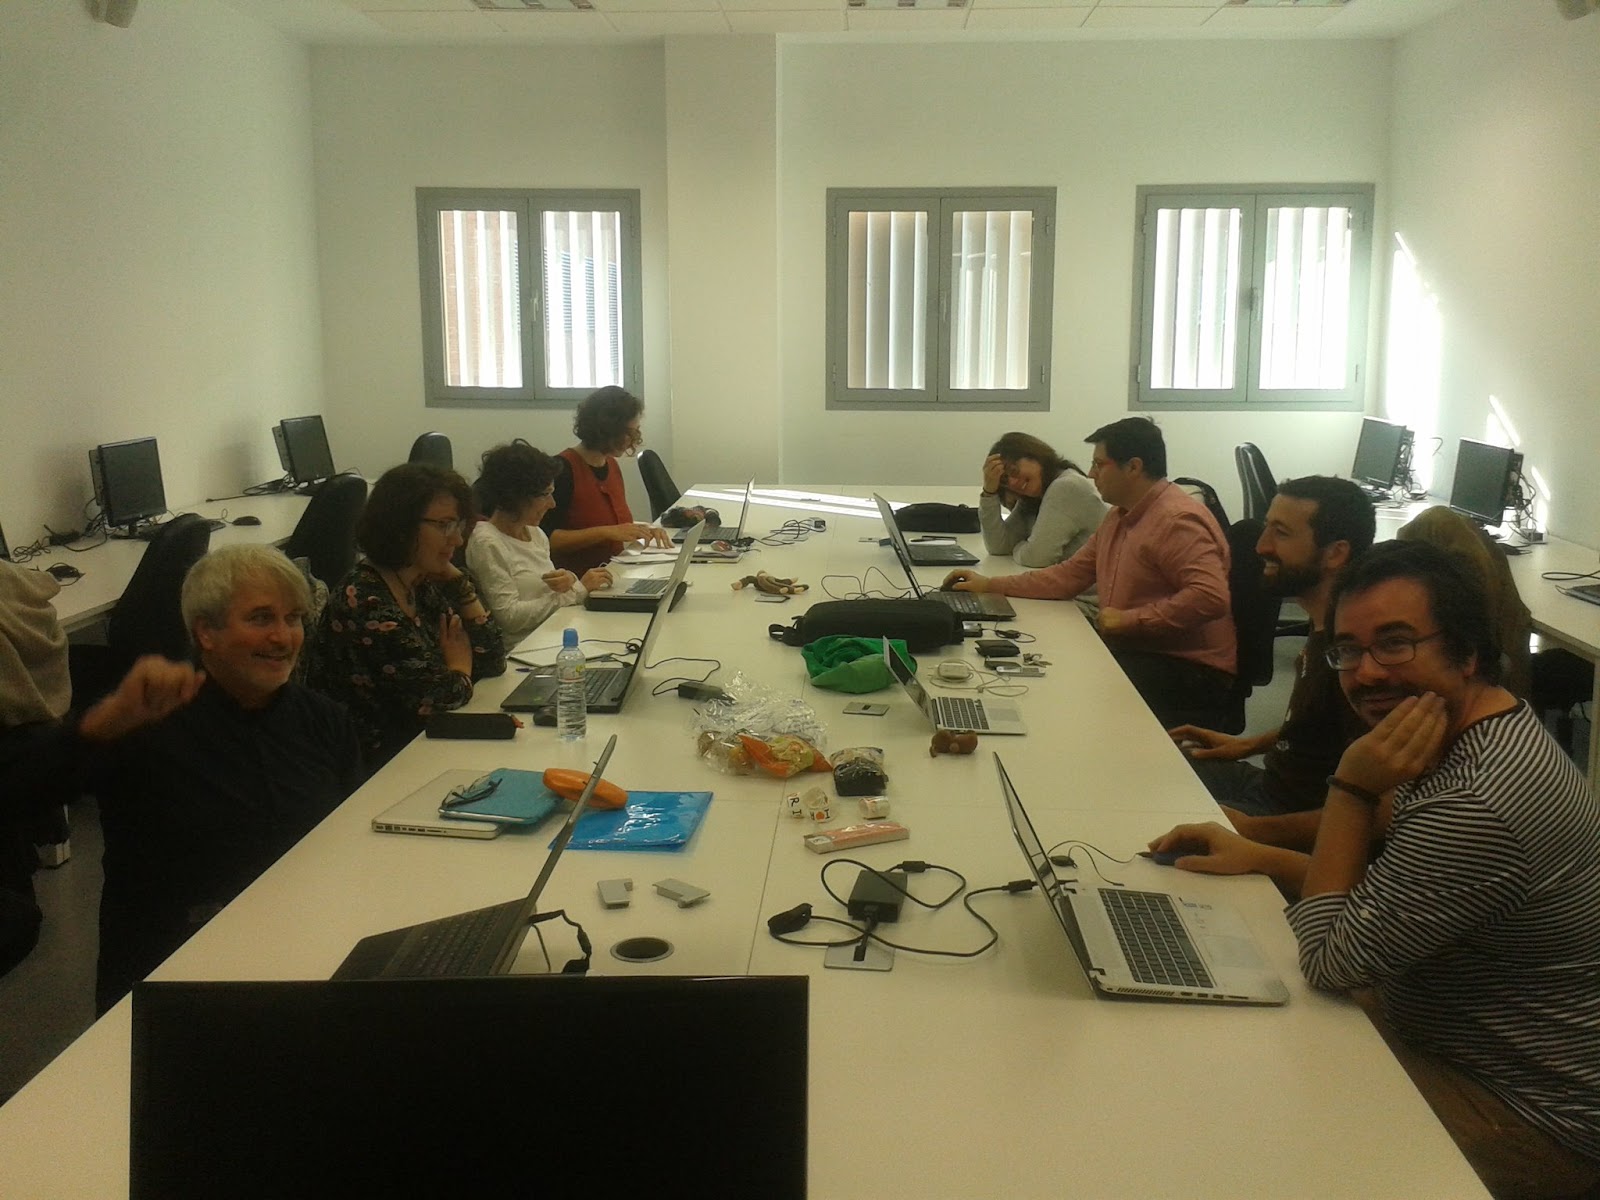
R Consortium recently talked to Francisco Rodriguez-Sanchez of Seville R User Group (also on Twitter) about the growth of the group over the years and the challenges of online events. Francisco discussed the diverse nature of the R community in Seville and the importance of physical events for the community. He also shared their struggle with finding speakers for their events and the tricks they have acquired from other groups to overcome this issue.
Francisco is a Data Scientist, Computational Ecologist, and R programmer. He did his Ph.D. in biology from the University of Seville and is currently doing his research on forests and climate change.
What is the R community like in Seville?
Seville is a medium-sized city with a population of about 1.5 million, including the outskirts. It is a pretty big city and there are many people using R. There is a delightful mix of people from universities, research institutes, and also people who use R for their work. Although there are not many big industries in Seville, there are many businesses doing analytics and machine learning stuff. Many of them use R. So we have a pleasant mix of academic and private businesspeople using R for many things.
I guess there are probably over 10,000 people (maybe many more) using R in Seville. Of course, not all of them come to the user group. But in the group right now, there are over 600 people on Meetup, and we also have over 600 followers on Twitter. We created the group in 2014, but we were a tiny group. In 2017, we started using Meetup with 100 members and the group grew quickly. In meetings, we have normally between 20 to 40 people.
If we talk about Spain, Madrid and Barcelona are the biggest cities and have big and very active R communities. They also have R-Ladies groups and a lot of innovative stuff is happening over there. Most of the businesses are based in Barcelona or Madrid, although we have a few here in Seville as well. R is also being taught in universities, so people who attend universities get exposed to it. In the private sector, some people use R, but Python is also very strong.
How has COVID affected your ability to connect with members?
We stopped having our regular meetings because of COVID. The last meeting we had was in February 2020. We only had some activity on Twitter and hosted a couple of online events. When the situation looked better, we tried to plan meetings, but things started getting worse again. It was a complicated situation, and you couldn’t really plan to get people in a room to meet.
Last year, in November, we planned another physical meeting. The Omicron wave came in January, so we had to switch to online again. We had a meeting at the end of January.
During the pandemic, R groups worldwide organized really amazing online events. Recordings of many great talks from different R users’ groups and R conferences are available online. So we didn’t feel the need to fill that niche and preferred to stay quiet.
As a group, we really preferred getting together in the same place. We not only had the talks, but we also used to hang out in a quiet bar afterward. Meeting and discussing different projects was really important for us. If we don’t have that, then the meetings are not very attractive for many people. During the online meeting in January, very few people attended and there were no questions. We uploaded the talk to our YouTube channel and many people watched the talk afterward. But the meeting itself was much less interactive, and it felt a bit isolating.
We are looking forward to the pandemic getting settled so that we can start with physical meetings again.
In the past year, did you have to change your techniques to connect and collaborate with members? For example, did you use GitHub, videoconferencing, online discussion groups more? Can these techniques be used to make your group more inclusive of people that cannot attend physical events in the future?
Before the pandemic, for years we already recorded our talks and uploaded them to our YouTube channel. So people who couldn’t come to the meetings could watch the talk and make comments. We also shared the slides on our website and our GitHub.
To keep us all connected, we also created a telegram channel for anyone to join and ask questions. We hope it will keep growing, but so far it’s just starting. And, of course, we have the meetup group where we share announcements and some activities that may interest people, but it’s not a really active communication channel.
So in terms of inclusivity, at the beginning of the term, we always send surveys to our members to decide what’s the best time and day to meet. Normally, it’s on Tuesday or Thursday in the evening. And for those people who can’t come, they can watch it online. And that’s what we have planned. Hopefully, we will keep it a mix of physical and online meetings for people who cannot come. But we are really looking forward to getting together.
I feel that the best thing we can do for the R community in Seville is get together to know each other and share knowledge. And that’s something that is hard to achieve in online-only events, so we are looking forward to hybrid events.
Can you tell us about one recent presentation or speaker that was especially interesting and what was the topic and why was it so interesting?
Last week was very interesting for me. It was about KoBotoolbox, which is an open-source software to design data collection forms. It allows you to design the form and send it to people, who can then fill it in from their phones or their computers. In the field or in humanitarian crises, it can make data collection very easy. And then it also allows you to access, visualize and share the data you have collected. I wasn’t familiar with this tool and it was an eye-opening talk for me. I feel it has immense potential and is very useful for people who need to collect data.
Before the pandemic also, we had really great talks. As an academic, I have learned a lot about big data and innovative machine learning stuff from people working in the private sector.
What trends do you see in R language affecting your organization over the next year?
I am not really an expert, but I think all the visualization stuff is very attractive to many people. And there is continuous progress in visualization in R, so I think that’s going to be a powerful characteristic of R. I also think that the rmarkdown ecosystem is powerful, and it fascinates many people.
And then maybe a bit more niche. The spatial stuff in R is something I use a lot, and I feel there is a lot of interest in that. The capabilities to do geospatial stuff with R have kept growing over the last ten years and that’s amazing.
Another thing I have noticed in our group is that when people do advanced machine learning, they move to Python. I really hope that we can change the perception that it is not possible to do advanced machine learning in R. I think that R Studio and others have done some really great work in this direction and R can do advanced machine learning. I wish people doing deep learning and machine learning keep using R and keep teaching it to us in our meetings. That’s a thing I would like to see in the next year or a few years.
Do you know of any data journalism efforts by your members? If not, are there particular data journalism projects that you’ve seen in the last year that you feel had a positive impact on society?
We don’t know any data journalists in our group, but we have marvelous examples of data journalism here in Spain. It’s really recent, there are many journalists doing impressive data work now and there is a lot of interest. Many universities are offering Masters in Data Journalism.
With COVID, there has been amazing work by many newspapers and journalists. I have seen amazing reports regarding COVID, visualizing it, and explaining it to the public. A project that I like is DataDista. They have developed a few projects investigating topics like the problem of water management in Spain, which is a huge issue in the South of Spain. They are investigating the problem of illegal extraction of underground water and have published an impressive report on the work. And as far as I know, they use R for their research and visualization. There is a lot of data collected on COVID. They collect all the data from official reports and publish it in a public GitHub repo every day. They have also worked on the problem of macro-farms. These vast farms with thousands of animals pose serious environmental problems. So they are an amazing example of data journalism. There are many examples in Spain, and it’s a thriving community.
R Consortium has funded a few projects related to spatial capabilities in R, like SF or STARS, and also the R interface to Google Earth Engine. So I believe that support from the R-Consortium has been critical to making R a powerful ecosystem for spatial analysis. There has been enormous progress and it has attracted many people to the R ecosystem.
And then one project that I really like is the R Ladies. I think it is amazing, and it is something very characteristic of the R community. It has been amazing and there has been a lot of activity with R Ladies’ groups around the globe. So I guess the R Consortium’s support has also been important there to grow this momentum.
From what I have seen from the outside, I have enjoyed R/Medicine activities and also R in Pharma. Both have organized really interesting meetings, with lots of exciting talks and workshops. Even though I haven’t attended their events, I keep an eye on them and I am amazed by what they have done.
When is your next event? Please give details!
We are planning a physical meeting around May. If we still cannot meet in a room, then we will probably have something online.
We do struggle to find speakers for our events. We know that there are thousands of people using R every day, but it’s very difficult to get them to come to our meetings and speak. Many of them feel they don’t know enough. We try to encourage people to speak, regardless of the level. We don’t need to have only advanced topics, we can also have really basic topics.
Running this group is a pleasure and the only struggle has been finding volunteers to give talks. I would love to know tricks to fix this. From other R groups, we have learned that you need to approach speakers individually, instead of a general call for speakers. You need to know your community, the people, and what they are doing. Then you need to approach them individually and invite them personally to come.
Luckily we have a couple of people that agreed to give a talk in the future. So we will probably have something this spring about crime investigation and mapping with R. We have an expert on that here in Seville and he agreed to talk. We would like to have one talk every two months if possible or at least once per quarter. We used to have one per month but we struggle to have speakers so we space them a bit more.
R consortium talks to Nino Macharashvili of DataFest Tbilisi (also on Facebook) on how they are dealing with life in the COVID age. As they were one of the early adopters of online conferences, having one shortly after the start of COVID, they have an interesting take on attendance. Nino also has an interesting take on a top-level project to help train more future professionals into the R language.
What is the R community like in Tbilisi?
Our event is very regional. We started DataFest Tbilisi in 2017, and it was mostly an Eastern European Union (EU) and Central Asian event. Our speakers were always from all over (North America, EU, and Asia). In the last two years, we have been online due to COVID, and our event has become more global, with more than 50 countries attending. However, we still had the biggest chunk from Eastern EU and Central Asia. Because of our location, we tend to have a manageable time zone for a global conference, with only a few people waking up early or staying up late.
How has COVID affected your ability to connect with members?
With the virus, we had to have everything go online. We were able to start experimenting with different ways to run a conference online. In the first year, for the first 2 months, we noticed that there were hardly any online events. Come March we noticed that many different events were going online. We started going in right away and ended up pioneering online conferences. We got a nice response from the audience for the first conference because we were available when many people were in a strict lockdown. We were able to offer an opportunity to connect with others in the community and learn. For me, it was a very positive experience. We wanted to be a global conference, not just for speakers but also for the audience. It was much easier to do this with online events. However, after 1 year we saw some differences, Georgia and most of the EU were going back to normal. We also noticed people didn’t want to go back on zoom due to zoom fatigue. I’d personally like to keep the conference offline, online, and hybrid.
In the past year, did you have to change your techniques to connect and collaborate with members? For example, did you use GitHub, video conferencing, online discussion groups more? Can these techniques be used to make your group more inclusive to people that are unable to attend physical events in the future?
We ended up using Zoom and a slack channel. We did look at using hopin, but we decided that simpler was for the best. So we decided to keep with the technology that most people were used to.
Can you tell us about one recent presentation or speaker that was especially interesting and what was the topic and why was it so interesting?
My favorite presentation was on Artificial Intelligence (AI) from our recent meeting. One striking fact was how the EU is racing to catch up with the US in AI and are investing heavily in it. The US is ahead, and the EU is close behind, but Georgia needs to catch up. I like it because it was a talk that brought up the issues and obstacles of AI and not just the overhyped part of AI.
What trends do you see in R language affecting your organization over the next year?
R is not the only language that is used by our members. As far as trends in coding in general, we are looking at tools that do coding themselves (self-coding code). We still need people who know how to use it and why to use it, however. We need to interest people from other sectors so we can show people how to apply the code to their field.
Do you know of any data journalism efforts by your members? If not, are there particular data journalism projects that you’ve seen in the last year that you feel had a positive impact on society?
We usually have data journalism as a track event. One of the main goals is to use data to debunk misinformation. This is one of our current projects. We have so many different projects. One of my favorite talks was a talk on COVID-19 in Brazil.
R ladies is an important program that should be kept. The R Ladies’ role is very important in popularizing R among everyone and not just in bringing in women. By making R more approachable, it increases interest in many different groups, and R Ladies has shown us that. It is important in communities like ours, where the R community is not large. It has the power to unify the groups.
There are four projects that are R Consortium Top Level Projects. If you could add another project to this list for guaranteed funding for 3 years and a voting seat on the ISC, which project would you add?
While I think R in data visualization would be a great choice, but I’m a bit biased because that is my field. However, what would be better for my area would be to provide support to start teaching R in University programs. In Georgia, there are not many people who use R. Most people learn about it from Twitter and start using it there. Some people start learning at workshops, and it slowly starts to trickle into the professional world. However, some professors are set in their ways and the software that they use. So, having support to get professors into using R and competitions for students would be very helpful. Their students will be the new professionals of the future and will push R in their jobs.
The largest data journalism conference in Latin America reaches its sixth edition in a row bringing discussions on the climate crisis, access to information, and data protection, in addition to dozens of workshops with experts.
Editor’s note: There are four R-related workshops @ Coda.Br 2021 (Data and health: Sivep without secrets, Tools to mitigate AI biases, Creating a reproducible project in R, and Graphs everywhere: how to create and analyze graphs). Please see below for details.
The conference was created by Escola de Dados (School of Data Brazil), the Open Knowledge Brasil’s data literacy program, Coda.Br is the leading data journalism event in Latin America and will be entirely online for the second year in a row, with free and paid activities.
Three main debate panels, three keynote presentations with international guests, and the final of the Cláudio Weber Abramo Data Journalism Award will be broadcasted openly and free of charge on the event’s website. Paid activities include more than 30 hours of hands-on workshops with experts in the field. The audience can join the workshops with a simple registration (from R$40) or via the Escola de Dados membership program.
Two hundred ninety-five free subscriptions will also be offered to increase the attendance of underrepresented groups. The public call is open until November 1st.
The sixth edition of the Digital Data and Methods Journalism Conference is developed with Google News Initiative and has the support of the US Embassy and Consulates in Brazil; the Hivos Foundation; the Brazilian Institute of Teaching, Development, and Research (IDP); the Brazilian Association of Investigative Journalism; the Brazilian Institute for Research and Data Analysis (IBPAD); from Insper; R Consortium and Datopian.
LAI and LGPD, book launch and climate crisis
Focusing on the complementary relationship between transparency and privacy, the first panel will discuss how public institutions deal with the Law on Access to Information (LAI) after the General Data Protection Law (LGPD) came into force in Brazil. Fernanda Campagnucci, CEO of Open Knowledge Brasil, will moderate the discussion of the following speakers Maria Vitória Ramos (Fiquem Sabendo), Jamila Venturini (Derechos Digitales), Paulo Rená (Instituto Beta).
The panel “Data Journalism in the World” marks the launch of the Portuguese version of “The Data Journalism Handbook: Towards a Critical Data Practice” with Natália Mazotte (Insper), one of the founders of the School of Data in Brazil, in addition to the participation of Cédric Lombion (Open Knowledge Foundation), Liliana Bounegru and Jonathan Gray (King’s College London).
And while the United Nations Conference on Climate Change (COP26) brings together global leaders, Coda.Br will debate the coverage of the climate emergency by journalism, pointing out problems and possible solutions in this area in the panel “Climate crisis in data journalism”. The activity will be moderated by Gustavo Faleiros (InfoAmazonia) and will feature Letícia Cotrim da Cunha (UERJ), Francy Baniwa (National Museum), and Clayton Aldern (Grist).
This year’s keynote presentations include Gurman Bhatia, an independent data visualization designer; Sondre Solstad, data journalism editor at The Economist; and Jim Albrecht, director of product management at Google. The Cláudio Weber Abramo Award for Data Journalism ceremony ends the Conference, with presentations by the finalists and the announcement of the winning projects of this edition of the award.
INFO
6th Coda.Br – Brazilian Conference on Data Journalism and Digital Methods
Date: November 8th to 13th
Value: R$40 (access to all event activities) or R$180 (one-year subscription to Escola de Dados, which allows access to the event and other benefits).
Registration and more information about the schedule:
School of Data is a global network aiming to empower citizens to contribute to the strengthening of democracies. Escola de Dados is the local chapter of this network and part of Open Knowledge Brasil (OKBR). The program trains researchers, NGOs and journalists, teaching them how to use open data to promote well-informed debates and create effective narratives for their agendas.
ABOUT OPEN KNOWLEDGE BRAZIL
Created in 2013, Open Knowledge Brasil (OKBr) is the local chapter of Open Knowledge Foundation. It is a non-profit Civil Society Organization (CSO) that uses and develops civic tools, projects, public policy analysis, and data journalism training to promote open knowledge in various fields of society.
R-related workshops @ Coda.Br 2021
Data and health: Sivep without secrets
By Carolina Moreno and Raphael Saldanha
Come learn how to analyze the most useful database to cover Covid-19 in Brazil: the Sivep-Gripe. It is using it that authorities, experts and journalists follow the trends of hospitalizations and deaths. This anonymized base is public and is available to anyone who knows how to handle large datasets. However, knowing the code to manipulate the data is not enough. In this workshop, you will have access to specific knowledge about the correct filters to be made, in addition to the dynamics of information systems and epidemiological issues that must be taken into account in the coverage.
Carolina Moreno is a senior data journalist for TV Globo. She has been a journalist since 2006, specializing in journalism editing since 2009, and has produced data-driven reporting since 2017. She covers Covid-19 pandemic data from its beginning for local and national news programs. Winner of the 2014 and 2015 Andifes Award, second place in the 2019 Impa Award. Participant in R-Ladies São Paulo since 2019.
Raphael Saldanha is a health data scientist, with PhD in Health Information and Communication from Fiocruz, one of the most prestigious health institutions in Brazil. He works on quantitative health research and the production of data visualization dashboards. He has been working with COVID-19 data since the beginning of the pandemic, building Fiocruz MonitoraCovid-19’s COVID-19 monitoring panel. He has been teaching R courses since 2010.
Tools to mitigate AI biases
By Gabriela de Queiroz e Paolla Magalhães
In this workshop, you will learn how to measure and mitigate bias in your data and models using the AI Fairness 360 open-source toolkit. You will learn which metric is most appropriate for a given case and when to use many of the different bias mitigation algorithms. The workshop will mention the R package.
Gabriela de Queiroz is a Chief Data Scientist at IBM California leading AI Strategy and Innovations. She drives the AI adoption across existing and potential customers, lead outreach strategy across our open source ecosystem and data science community. Previously she was a Program Director working on Open Source, Data & AI Technologies at IBM.
Creating a reproducible project in R
By João Santos
In corporate and scientific works we are increasingly faced with scenarios where we try to reproduce the code written by someone else and we find inconsistencies and errors. The solution to these problems lies in a series of practices and conventions that ensure that your code runs consistently. In this workshop, you will learn how to develop a reproducible project in R. We will make use of libraries and directory organization best practices, making our results permanently consistent.
João is currently a Jr. Data Engineer at Account Split. He serves as a research assistant in the Department of Political Science at Emory University, where he researches political disinformation. He is a major in International Relations at PUC-Rio, and holds the AWS Certified Cloud Practitioner certification.
Graphs everywhere: how to create and analyze graphs
By Janderson Pereira
The purpose of this workshop is to present the concepts of graphs and relational data used to identify groups and their subjectivities. The idea is to show how to extract data from social networks, especially Twitter or Youtube, and then treat them to visualize interactions in order to be able to find groups that emerge when individual behaviours are aggregated. The R language and the Gephi program will be used to create the graphs.
Janderson is a data scientist and coordinator of innovation and forecasting at Natura & Co. He is a researcher at Citelab/UFF – Research Laboratory in Science, Innovation, Technology and Education and has a major in Media Studies at the Fluminense Federal University. He develops research in the area of social network analysis, focusing on methodologies for disseminating disinformation on social networking sites.
In this session we will be looking at various learnings obtained from creating a corporate R infrastructure and developing R packages to address the unique business problems presented by clinical trials.
Architecting and maintaining an R installation across a large organisation can be challenging. How do you balance between giving individual users the ability to meet their specific needs, but also provide a standardised environment which meets regulatory requirements? As R needs expand, then internal packages also get created, and these also need to be managed.
It is often useful to create custom R packages to complement the community R packages. We are developing both open and closed source packages that we validate and deploy on our R infrastructure. We will be discussing some learnings from the NEST software development team including: project management, automation, devops, testing, integration, releasing, validation, and deployment of the in-house built R packages. We will also be presenting steps we took towards simplifying the development process to enable co-creation and collaboration with internal and external developers.
Finally, we will split into break out rooms to discuss some relevant topics on how package creation and management can be dealt with effectively.
R Consortium talks to Harvey Lieberman on their growth both pre and post COVID. They have adapted in a way that promotes R in Pharma as well as allowing them to be more inclusive.
R/Pharma is being held Nov 2-4, 2021. Register today! More information available here: rinpharma.com
RC: What is the R community like in R Pharma?
We have an amazing community! We have been able to pull together a group of like-minded people who wish to contribute to R/Pharma. Each year we hold a conference that is entirely community driven from the organizing and program committees to those who work on presentations and workshops.
As a community-led effort anyone who wants to help can do so. Last year we tried to identify people who work on R in smaller biotechs so that we do not become too polarized towards bigger pharma companies.
We also have an active slack group that helps build community.
RC: How has COVID affected your ability to connect with members?
A little history of R/Pharma so you can see how it evolved with COVID. We formed a few years ago with the main focus being holding a conference. It was clear that a lot of people were working with R in Pharmaceutical companies from early research through to production, but there wasn’t a conference focussed on this. There were many statistics-based conferences, several geared towards SAS, but nothing industry-based for R practitioners. The first two conferences we held were face-to-face at Harvard University in 2018 and 2019 with 150 attendees. It was clear that more people wanted to attend but we were limited in space. Late 2019 we started to think about how to expand, to accommodate more attendees, and then COVID hit. We quickly pivoted to a virtual event and ended up reaching far more people – with over 1000 registrations for 2020 and we are expecting more for 2021.
Our conference historically attracted attendees from USA and Europe. The benefit of going virtual is that we can bring together people from all over the World. The challenge in managing this post-COVID. R/Pharma has always strived to be a free conference without sponsors and we will be relying on our community to help put future events on in this spirit.
For 2022 we are hoping to host a hybrid event.
RC: In the past year, did you have to change your techniques to connect and collaborate with members? For example, did you use GitHub, video conferencing, online discussion groups more? Can these techniques be used to make your group more inclusive to people that are unable to attend physical events in the future?
We have an active slack group which has been growing steadily since 2018. For the conference we use a GitHub repo to archive presentations and workshops, linked to our website. We also have a YouTube channel containing recorded talks and workshops from 2020. We can look at COVID as a double-edged sword with respect to connection – we were able to reach many more people last year but we lost the interpersonal interactions. It’s important to us to be inclusive and virtual experiences break down many barriers.
With regards to the conference in 2020, we held workshops via Zoom and the main conference through the hopin platform. One way in which we promoted additional interaction was through virtual conference booths so that open source authors could showcase their packages and shiny apps. We aim to host the 2021 workshops and conference the same way.
RC: Can you tell us about one recent presentation or speaker that was especially interesting and what was the topic and why was it so interesting?
We have been blessed with so many great speakers over the past three years. In our first year Joe Cheng gave a talk on Using Interactivity Responsibly in Pharma. Joe is an amazing presenter who can take a topic that is complex and explain it in a way that everyone can understand. The R/Pharma community is amazing and we always have incredible workshops in addition to talks. One that comes to mind is Leon Eyrich Jessen’s workshop on Artificial Neural Networks in R with Keras and TensorFlow. It’s a highly complex topic which Leon teaches in a 3- or 4-hour workshop, from which you leave thinking “how can I now apply this to my own problems?”
RC: What trends do you see in R language affecting your organization over the next year?
I think the big one in Pharma, in general, is R for Submissions. This is a space that traditionally has been very heavily SAS-oriented. There is certainly a move in the industry to start to use R. It’s slow because it requires a large amount of retraining, changing infrastructure and dealing with regulations. Leaving college now, you are more likely to be an R expect than a SAS expert.
Another area of growth within the industry are shiny apps. This has democratized the ability to communicate complex statistical outputs. Couple that with shiny modules and you have the ability to build complex interactive graphical apps rapidly.
RC: Do you know of any data journalism efforts by your members? If not, are there particular data journalism projects that you’ve seen in the last year that you feel had a positive impact on society?
Externally I do not but everyone in the industry uses these as a way to communicate internally on a daily basis. I’m working in a group that has started using data stories as a way to communicate complex information in a digestable way. As a Brit I tend to read the BBC a lot and like how they are embracing data journalism. FiveThiryEight too is a great site.
RC: When is your next event? Please give details!
R/Pharma 2021 will be held from November 2-4. Workshops will be running the week before. The event is free and you can find registration details on our website at rinpharma.com.
R Ladies is my favorite, mainly because it was something very conscious. We did have an imbalance in our industry Ladies is a favorite. Our industry is trying to address a gender imbalance and R/Pharma, as an organization, is very conscious of that.
The R Validation Hub is heavily connected to R/Pharma. Having a way to validate packages is very important to our industry. Members of the R Validation Hub regularly present or host workshops at R/Pharma.
RC: There are four projects that are R Consortium Top Level Projects. If you could add another project to this list for guaranteed funding for 3 years and a voting seat on the ISC, which project would you add?
R for submissions. The R Consortium is spearheading an effort that is complex but important to our industry. Having a way to bring multiple companies together to work with regulatory bodies is essential.
How do I Join?
R Consortium’s R User Group and Small Conference Support Program (RUGS) provides grants to help R groups around the world organize, share information and support each other. We have given grants over the past 4 years, encompassing over 65,000 members in 35 countries. We would like to include you! Cash grants and meetup.com accounts are awarded based on the intended use of the funds and the amount of money available to distribute. We are now accepting applications!
The Enterprise Applications of the R Language Conference (EARL) is a cross-sector conference focusing on the commercial use of the R programming language. The conference is dedicated to the real-world usage of R with some of the world’s leading practitioners. This year, it was held September 6-10, 2021.
Thank you to everyone who joined us for EARL 2021 – especially to all of the fantastic presenters! We were pleased to receive lots of really positive feedback from the online event and there are plenty of highlights to share.
Branka Subotic, NATS
It was great to kick off EARL 2021 with our first keynote of the day from Branka. She has worked for NATS since 2018 and is currently their Director of Analytics. Branka shared with us interesting ways to help teams to work together and also some unusual ways to upskill! Her talk was peppered with some videos showing us flight data and the impacts of Covid.
Chris Beeley, NHS – Stronger together, making healthcare open- building the NHS-R Community
We are always delighted to hear from the NHS at the EARL Conference and this year was no exception. We were treated to a passionate talk from Chris on how the NHS-R community has been built up over the years and how their conference has gone from strength to strength. We all know how supportive the R community can be, so it is great to see this in action.
Amit Kohli – Introduction to network analysis
Amit gave us an introduction to the principles of network analysis and shared several use-cases demonstrating their unique powers. Amit also included a fun way to interact with his talk with the use of a QR code – we can always rely on Amit to entertain us! Our team thought it was a really interesting topic and it felt accessible to those who perhaps don’t know much on the subject.
Emily Riederer, Capital One – How to make R packages part of your team
We loved Emily’s fun concept of making R packages a real part of your team and her use of code, and the choices she made along the way. Her talk examined how internal R packages can drive the most value for their organisation when they embrace an organisation’s context, as opposed to open source packages which thrive with increasing abstraction. Read our interview with Emily here.
Dr. Jacqueline Nolis, Saturn Cloud
We closed the day with our final keynote talk from Jacqueline Nolis. She is a data science leader with over 15 years of experience in managing data science teams and projects, at companies ranging from DSW to Airbnb. She currently is the Head of Data Science at Saturn Cloud where she helps design products for data scientists. Jacqueline spoke to us about taking risks in your career and shared with us the various risks she has taken over her career and how they went! It was inspiring to hear from an experienced data scientist that it’s ok to take a risk every now and then – and refreshing to hear her honesty about what could have gone better – and how she has ultimately learned and grown from this.
These are just a few of the brilliant talks from a fantastic conference day. It was a delight to have speakers and attendees joining us from across the world – so thank you again to all that came along.
We are hoping to be back in London next year to host EARL in-person again. We are tentatively holding the 6th-8th of September 2022 as our conference dates. If you’d like to keep up-to-date on all things EARL please join our mailing list. We will open the call for abstracts in January 2022.