Announcing R/Medicine 2022! The conference will be fully virtual from August 23 through 26 and feature two days of workshops (included with the low registration fee!) and two days of keynotes featuring JJ Allaire and Frank Harrell.
R / Medicine is the premier conference for the use of R in clinical practice and reflects the increasing importance of data science and machine learning to the everyday lives of physicians and other healthcare professionals. Topics include working with clinical data, statistical modeling, forecasting, reproducible research, clinical reporting, R package development and more. Check out some highlights from previous conferences on our YouTube channel!
Early Bird Registration is now open so sign up for the conference now! We are accepting proposals for 30 minute talks, 30 minute panel discussions, and 10 minute lighting talks.
Interested in sponsoring R/Medicine? Please take a look at our sponsorship brochure.
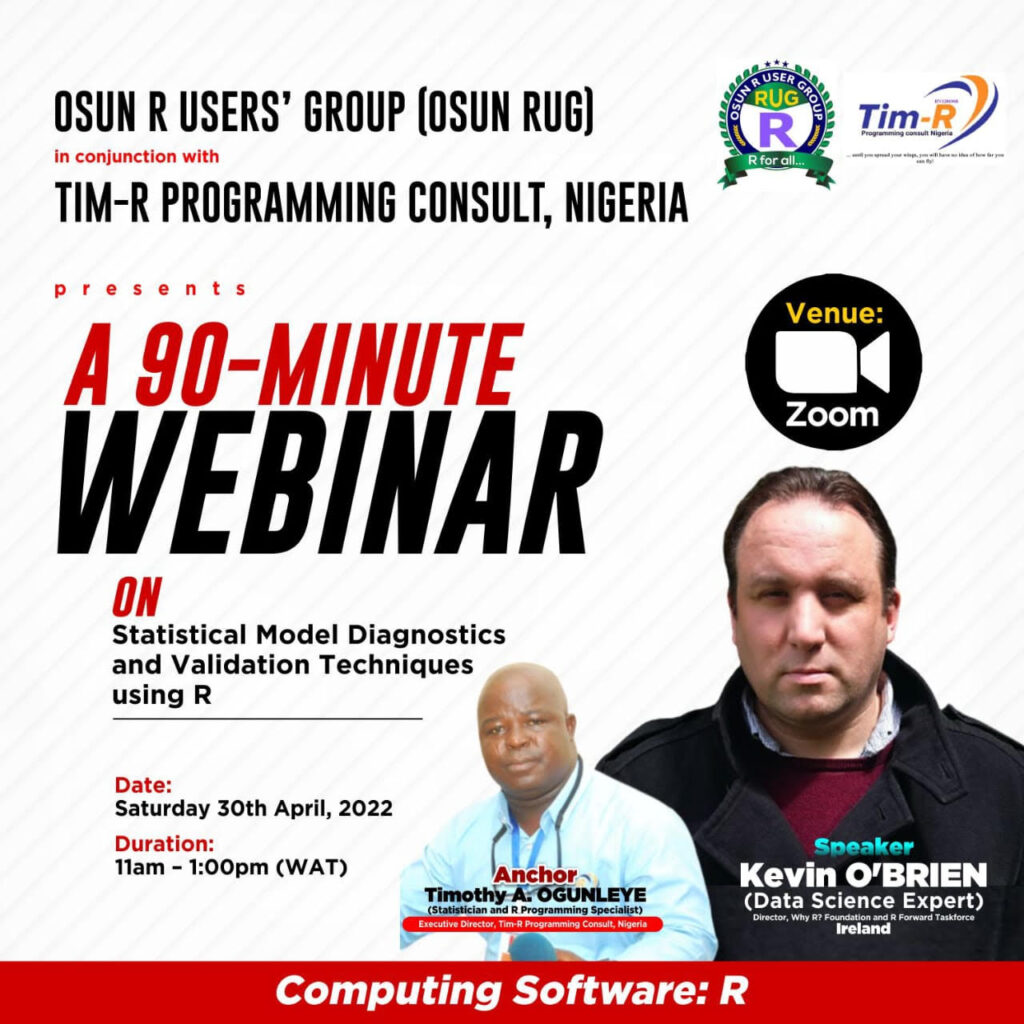
Organized by the OSUN R USERS GROUP, Nigeria, and coordinated by Timothy A. OGUNLEYE. Speaker Kevin O’Brien is an active contributor of the R Consortium’s Inclusion, Diversity, Equity, and Accessibility (IDEA) Working Group. The R-Community IDEA is a top level project of the R-Consortium with the goal of broadly considering how the R Consortium can best encourage and support diversity and inclusion across a variety of events and platforms. This includes Code of Conduct development, speaker support, and connecting with the global R-User community. If you’d like to learn more or get involved, please join our monthly public meeting.
Model validation is a vital part of the statistical modeling process, but is often overlooked in statistical courses. This process allows the analyst to properly validate the assumptions underlying the model, once applied to the data.
In this presentation, we will look at residual analysis and influence measures for linear models, with some associated topics. The talk is aimed at students and early career data professionals who have already encountered conventional regression analyses, and are familiar with the model fitting process in R (i.e. the ‘’lm()’’ function).
The talk will introduce a mixture of graphical procedures, statistical measures and hypothesis tests, which the attendees are invited to learn more about beyond the talk. The talk will feature the {CAR} R package, but all of the other functionality is available in Base R or Tidyverse.
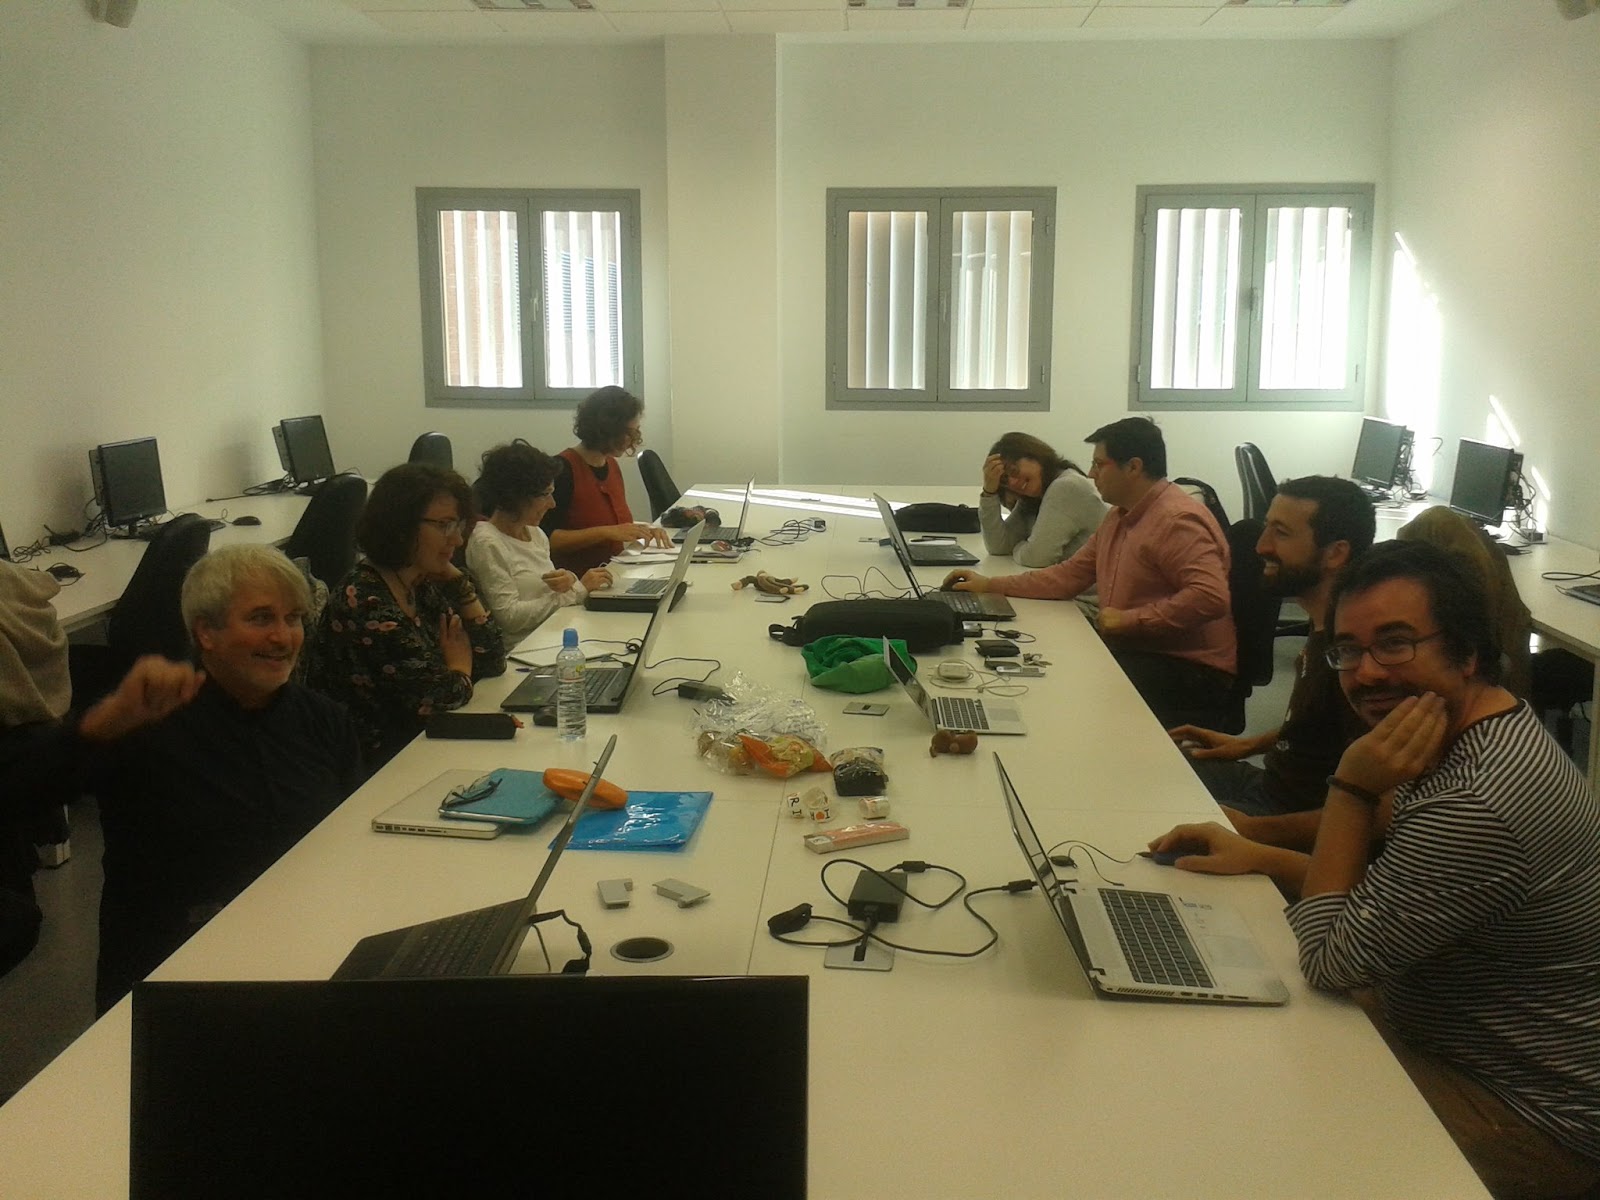
R Consortium recently talked to Francisco Rodriguez-Sanchez of Seville R User Group (also on Twitter) about the growth of the group over the years and the challenges of online events. Francisco discussed the diverse nature of the R community in Seville and the importance of physical events for the community. He also shared their struggle with finding speakers for their events and the tricks they have acquired from other groups to overcome this issue.
Francisco is a Data Scientist, Computational Ecologist, and R programmer. He did his Ph.D. in biology from the University of Seville and is currently doing his research on forests and climate change.
What is the R community like in Seville?
Seville is a medium-sized city with a population of about 1.5 million, including the outskirts. It is a pretty big city and there are many people using R. There is a delightful mix of people from universities, research institutes, and also people who use R for their work. Although there are not many big industries in Seville, there are many businesses doing analytics and machine learning stuff. Many of them use R. So we have a pleasant mix of academic and private businesspeople using R for many things.
I guess there are probably over 10,000 people (maybe many more) using R in Seville. Of course, not all of them come to the user group. But in the group right now, there are over 600 people on Meetup, and we also have over 600 followers on Twitter. We created the group in 2014, but we were a tiny group. In 2017, we started using Meetup with 100 members and the group grew quickly. In meetings, we have normally between 20 to 40 people.
If we talk about Spain, Madrid and Barcelona are the biggest cities and have big and very active R communities. They also have R-Ladies groups and a lot of innovative stuff is happening over there. Most of the businesses are based in Barcelona or Madrid, although we have a few here in Seville as well. R is also being taught in universities, so people who attend universities get exposed to it. In the private sector, some people use R, but Python is also very strong.
How has COVID affected your ability to connect with members?
We stopped having our regular meetings because of COVID. The last meeting we had was in February 2020. We only had some activity on Twitter and hosted a couple of online events. When the situation looked better, we tried to plan meetings, but things started getting worse again. It was a complicated situation, and you couldn’t really plan to get people in a room to meet.
Last year, in November, we planned another physical meeting. The Omicron wave came in January, so we had to switch to online again. We had a meeting at the end of January.
During the pandemic, R groups worldwide organized really amazing online events. Recordings of many great talks from different R users’ groups and R conferences are available online. So we didn’t feel the need to fill that niche and preferred to stay quiet.
As a group, we really preferred getting together in the same place. We not only had the talks, but we also used to hang out in a quiet bar afterward. Meeting and discussing different projects was really important for us. If we don’t have that, then the meetings are not very attractive for many people. During the online meeting in January, very few people attended and there were no questions. We uploaded the talk to our YouTube channel and many people watched the talk afterward. But the meeting itself was much less interactive, and it felt a bit isolating.
We are looking forward to the pandemic getting settled so that we can start with physical meetings again.
In the past year, did you have to change your techniques to connect and collaborate with members? For example, did you use GitHub, videoconferencing, online discussion groups more? Can these techniques be used to make your group more inclusive of people that cannot attend physical events in the future?
Before the pandemic, for years we already recorded our talks and uploaded them to our YouTube channel. So people who couldn’t come to the meetings could watch the talk and make comments. We also shared the slides on our website and our GitHub.
To keep us all connected, we also created a telegram channel for anyone to join and ask questions. We hope it will keep growing, but so far it’s just starting. And, of course, we have the meetup group where we share announcements and some activities that may interest people, but it’s not a really active communication channel.
So in terms of inclusivity, at the beginning of the term, we always send surveys to our members to decide what’s the best time and day to meet. Normally, it’s on Tuesday or Thursday in the evening. And for those people who can’t come, they can watch it online. And that’s what we have planned. Hopefully, we will keep it a mix of physical and online meetings for people who cannot come. But we are really looking forward to getting together.
I feel that the best thing we can do for the R community in Seville is get together to know each other and share knowledge. And that’s something that is hard to achieve in online-only events, so we are looking forward to hybrid events.
Can you tell us about one recent presentation or speaker that was especially interesting and what was the topic and why was it so interesting?
Last week was very interesting for me. It was about KoBotoolbox, which is an open-source software to design data collection forms. It allows you to design the form and send it to people, who can then fill it in from their phones or their computers. In the field or in humanitarian crises, it can make data collection very easy. And then it also allows you to access, visualize and share the data you have collected. I wasn’t familiar with this tool and it was an eye-opening talk for me. I feel it has immense potential and is very useful for people who need to collect data.
Before the pandemic also, we had really great talks. As an academic, I have learned a lot about big data and innovative machine learning stuff from people working in the private sector.
What trends do you see in R language affecting your organization over the next year?
I am not really an expert, but I think all the visualization stuff is very attractive to many people. And there is continuous progress in visualization in R, so I think that’s going to be a powerful characteristic of R. I also think that the rmarkdown ecosystem is powerful, and it fascinates many people.
And then maybe a bit more niche. The spatial stuff in R is something I use a lot, and I feel there is a lot of interest in that. The capabilities to do geospatial stuff with R have kept growing over the last ten years and that’s amazing.
Another thing I have noticed in our group is that when people do advanced machine learning, they move to Python. I really hope that we can change the perception that it is not possible to do advanced machine learning in R. I think that R Studio and others have done some really great work in this direction and R can do advanced machine learning. I wish people doing deep learning and machine learning keep using R and keep teaching it to us in our meetings. That’s a thing I would like to see in the next year or a few years.
Do you know of any data journalism efforts by your members? If not, are there particular data journalism projects that you’ve seen in the last year that you feel had a positive impact on society?
We don’t know any data journalists in our group, but we have marvelous examples of data journalism here in Spain. It’s really recent, there are many journalists doing impressive data work now and there is a lot of interest. Many universities are offering Masters in Data Journalism.
With COVID, there has been amazing work by many newspapers and journalists. I have seen amazing reports regarding COVID, visualizing it, and explaining it to the public. A project that I like is DataDista. They have developed a few projects investigating topics like the problem of water management in Spain, which is a huge issue in the South of Spain. They are investigating the problem of illegal extraction of underground water and have published an impressive report on the work. And as far as I know, they use R for their research and visualization. There is a lot of data collected on COVID. They collect all the data from official reports and publish it in a public GitHub repo every day. They have also worked on the problem of macro-farms. These vast farms with thousands of animals pose serious environmental problems. So they are an amazing example of data journalism. There are many examples in Spain, and it’s a thriving community.
R Consortium has funded a few projects related to spatial capabilities in R, like SF or STARS, and also the R interface to Google Earth Engine. So I believe that support from the R-Consortium has been critical to making R a powerful ecosystem for spatial analysis. There has been enormous progress and it has attracted many people to the R ecosystem.
And then one project that I really like is the R Ladies. I think it is amazing, and it is something very characteristic of the R community. It has been amazing and there has been a lot of activity with R Ladies’ groups around the globe. So I guess the R Consortium’s support has also been important there to grow this momentum.
From what I have seen from the outside, I have enjoyed R/Medicine activities and also R in Pharma. Both have organized really interesting meetings, with lots of exciting talks and workshops. Even though I haven’t attended their events, I keep an eye on them and I am amazed by what they have done.
When is your next event? Please give details!
We are planning a physical meeting around May. If we still cannot meet in a room, then we will probably have something online.
We do struggle to find speakers for our events. We know that there are thousands of people using R every day, but it’s very difficult to get them to come to our meetings and speak. Many of them feel they don’t know enough. We try to encourage people to speak, regardless of the level. We don’t need to have only advanced topics, we can also have really basic topics.
Running this group is a pleasure and the only struggle has been finding volunteers to give talks. I would love to know tricks to fix this. From other R groups, we have learned that you need to approach speakers individually, instead of a general call for speakers. You need to know your community, the people, and what they are doing. Then you need to approach them individually and invite them personally to come.
Luckily we have a couple of people that agreed to give a talk in the future. So we will probably have something this spring about crime investigation and mapping with R. We have an expert on that here in Seville and he agreed to talk. We would like to have one talk every two months if possible or at least once per quarter. We used to have one per month but we struggle to have speakers so we space them a bit more.
The R Consortium is pleased to announce the new 2022 R User Groups (RUGs), Conferences and Training program. This is an updated version of the RUGS program of previous years that aims to put more structure around the process of applying for support for R-themed conferences and training sessions.
The RUGS Program
The RUGS program supports R user groups and will operate in much the same way as the 2020 and 2021 RUGS programs. Because we are still all under the shadow of COVID-19, we expect user groups to hold on-line and/or in-person meetings.
RUGS grants will have two parts: Meetup.com support and cash grants. All user groups applying for the program, except for R-Ladies groups, will be automatically enrolled in our RUGS meetup.com RUGS Pro account. If you receive a grant, we will pay the meetup.com fees for your program for the year. R-Ladies has its own Meetup.com Pro account so you need to apply directly to R-Ladies to participate. Also note that if you are already participating in our RUGS meetup.com program and you are not seeking a cash grant, you do not need to reapply.
If you are seeking a cash grant for your user group, please be explicit about how much money you are seeking and what you intend to do with the funds. Be conservative, we need to make our pool of grant money cover the entire globe. All RUGS including R-Ladies groups are eligible to apply for cash grants.
Conference Grants
Formerly, the RUGs program was intended only for small conferences where all cash grants were limited to $1000. While $1000 is still the limit for small events, now there is a place on the enrollment form to seek funding for larger conferences. Of course, the more funds you are seeking the more justification you must provide about how your conference will benefit the R Community. Please do not apply for a conference grant until your conference website is up.
Training Sessions
Training sessions are a new category this year. Previously we treated training sessions as conferences. We realize conferences and training sessions are very different and that training sessions should be judged with their own set of criteria.
For details on requirements for each type of grant, visit the R User Groups, Conferences, and Training page on the R Consortium website and select “RUGs Program” under the Projects tab at the top of the R Consortium home page. Be sure to check the correct box on the application form.
The RUGS, Conferences and Training program for 2022 will be accepting requests for funding through the end of September 2022.
The first 2022 call for proposals for R Consortium Infrastructure Steering (ISC) grants is now open and will be accepting proposals through May 1, 2022. This year, the R Consortium has restructured its grant programs to allow the ISC to focus on technical projects. If you are contemplating a technical project that you think will have a significant impact on a relatively large segment of the R Community, please apply for a grant at the link above where you will find guidance on the kinds of projects the ISC is looking for, instructions on how to apply, as well information on the grant process.
Select “Funded Projects” from the “Projects” tab on the R Consortium home page. You will see a pull down box that points you to the previous projects funded by the ISC. Searching through these projects is not only a great way to review the history of ISC funding, but also a place to look for inspiration.
A typical ISC grant ranges between $5,000 and $20,000 and is structured in such a way that intermediate milestones correspond to meaningful work. If you look through the history of what the ISC funded in the past, you will find several examples of important projects that received additional grants over time. The ISC occasionally awards larger grants, but if you are seeking a large grant your best strategy is still to structure your project in a way that delivers value by way of intermediate milestones.
Since our first ISC call for proposals in 2016, the R Consortium has awarded $1.4M in grants. Help us help you make the R ecosystem even more awesome by organizing the good work that you may already be doing in a way that could be accelerated with a grant.
Note, if you are seeking funding for an R User Group, a conference, or for delivering a training session please don’t apply for an ISC grant. Instead, apply for a grant at the R User Groups, Conferences, and Training page.
“A worldwide epidemiological database for COVID-19 at fine-grained spatial resolution” by COVID-19 Data Hub developer, Emanuele Guidotti was published in Scientific Data on the March 28, 2022, and is available to view online at https://www.nature.com/articles/s41597-022-01245-1 (DOI 10.1038/s41597-022-01245-1).
The R Consortium is proud to be a sponsor of the COVID-19 Data Hub. We believe that the need for accessible, organized, official COVID-19 case data will persist for some time into the future, and that the COVID-19 Data Hub is a serious contribution to science and public health.
— Joseph B. Rickert, Chair R Consortium Board of Directors
PAPER ABSTRACT
This database provides the daily time-series of COVID-19 cases, deaths, recovered people, tests, vaccinations, and hospitalizations, for more than 230 countries, 760 regions, and 12,000 lower-level administrative divisions. The geographical entities are associated with identifiers to match with hydrometeorological, geospatial, and mobility data. The database includes policy measures at the national and, when available, sub-national levels. The data acquisition pipeline is open-source and fully automated. As most governments revise the data retrospectively, the database always updates the complete time-series to mirror the original source. Vintage data, immutable snapshots of the data taken each day, are provided to ensure research reproducibility. The latest data are updated on an hourly basis, and the vintage data are available since April 14, 2020. All the data are available in CSV files or SQLite format. By unifying the access to the data, this work makes it possible to study the pandemic on a global scale with high resolution, taking into account within-country variations, nonpharmaceutical interventions, and environmental and exogenous variables.
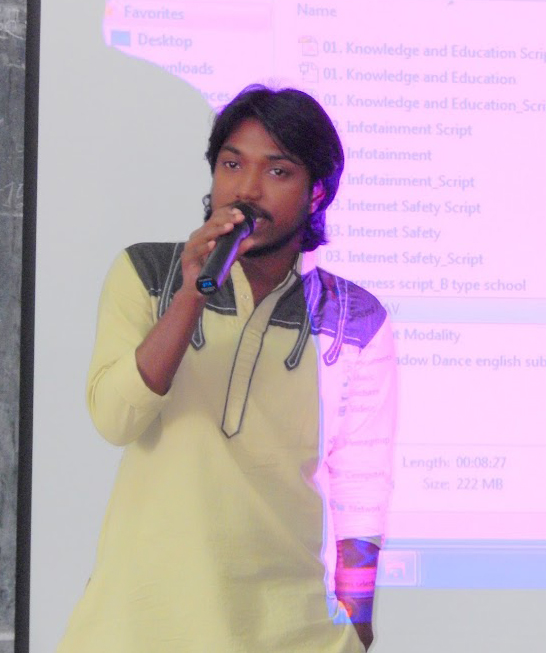
R Consortium talked to Bolaram Paul of the Sylhet R User Group about the challenges faced by the group because of the pandemic. As a group focused on physical events, they could not readily shift their events online. However, they are hopeful things will return to normal and they will organize physical meetups again. Bolaram also shared his vision of creating, as well as translating, R resources to the local language, to further facilitate the adoption of R in the country.
Bolaram is a Senior Web Developer who is passionate about open source technologies. He has been working with the open software communities and is also pursuing his Master’s degree in Computer Science.
What is the R community like in Bangladesh?
The R community in Sylhet is still in its early stages, although there are many R users in academia and industry in Bangladesh. R is getting popular in banking, e-commerce, finance, and many more sectors and people are getting more interested.
How has COVID affected your ability to connect with members?
We used to organize offline events in educational institutions, so that we could interact physically. Because of the outbreak of the pandemic, the government banned public gatherings. As we were not familiar with online events, the pandemic really affected our ability to connect. However, now things are getting back to normal, and we are planning to organize online events as well.
In the past year, did you have to change your techniques to connect and collaborate with members? For example, did you use GitHub, videoconferencing, online discussion groups more? Can these techniques be used to make your group more inclusive of people that cannot attend physical events in the future?
As we were used to offline programs, we didn’t use these technologies. But basically starting now, because of the COVID-19 situation, we are researching techniques to boost our communications and interactions.
Can you tell us about one recent presentation or speaker that was especially interesting and what was the topic and why was it so interesting?
We got a presentation from one lecturer at a local university. He discussed the diversity of R applications in various sectors and real-life use cases of R language. He made the talk really interesting by using images, and it captured my interest.
What trends do you see in R language affecting your organization over the next year?
Because of the pandemic, the entire world is facing a crisis. I hope we’ll find the best solutions to fight this crisis. My expectation for the next few years is to create or translate more R resources into our local language. I believe it will make interactions easy, and we will get more contributions in the development of R packages and usage examples in different disciplines.
Do you know of any data journalism efforts by your members? If not, are there particular data journalism projects that you’ve seen in the last year that you feel had a positive impact on society?
As far as I know, not in our community. I noticed a few local NGOs using data to analyze oxygen plant/bed/health supplement stock in nearest hospitals during the COVID-19 outbreak to help people. I believe data journalism is the future and journalists need to be data-savvy. We will try to organize a training session on data journalism.
My favorite is the RECON COVID-19 Challenge. It is a really helpful project for analytics resources in R, to support the response to COVID-19 worldwide.
R / Business. This ISC group works with the R programming environment and the R ecosystem in business research. This is very helpful for making optimal decisions based on data analysis and helps small startups make perfect decisions.
When is your next event? Please give details!
We have not scheduled our next event yet. We are hoping to schedule it soon.
The R Consortium is happy to announce that the R Submissions Working Group successfully completed the follow-up to the original pilot 1 eCTD submission! All submission materials can be found at: https://github.com/RConsortium/submissions-pilot1-to-fda
The pilot 1 test submission was an example submission package following eCTD specifications which included a proprietary R package, R scripts for analysis, R-based analysis data reviewer guide (ADRG), and other required eCTD components.
The initial submission was submitted through the eCTD gateway on Nov 22, 2021. An FDA written response letter was received on Dec 3, 2021. The FDA response commented on two minor findings and included a number of suggestions for best practices. The updated submission package addressed all of these issues and was submitted on Feb 11, 2022. The final response letter from FDA was received on Mar 14, 2022, and can be found at: https://github.com/RConsortium/submissions-wg/blob/main/Documents/Summary_R_Pilot_Submission2.pdf .
Throughout the submission process, we successfully submitted R scripts with its natural file extension (.r) through the eCTD gateway. A proprietary R package was also submitted through the eCTD gateway. Following the submitted ADRG, the FDA staff successfully installed the proprietary and open source R packages, reran the submitted R scripts, and reproduced the analysis results. In addition, the FDA staff performed independent programming in R to evaluate the results.
To our knowledge, this was the first publicly-available regulatory submission package using open source language; this successful pilot sets an important milestone to streamline future open-source language-based submissions.
As a next step, the R Consortium R Submission Working Group aims at initiating an R submission pilot 2 to experiment with Shiny app code submission through the eCTD gateway. In addition, the working group is also exploring R based pilot submissions to other health authority agencies globally.
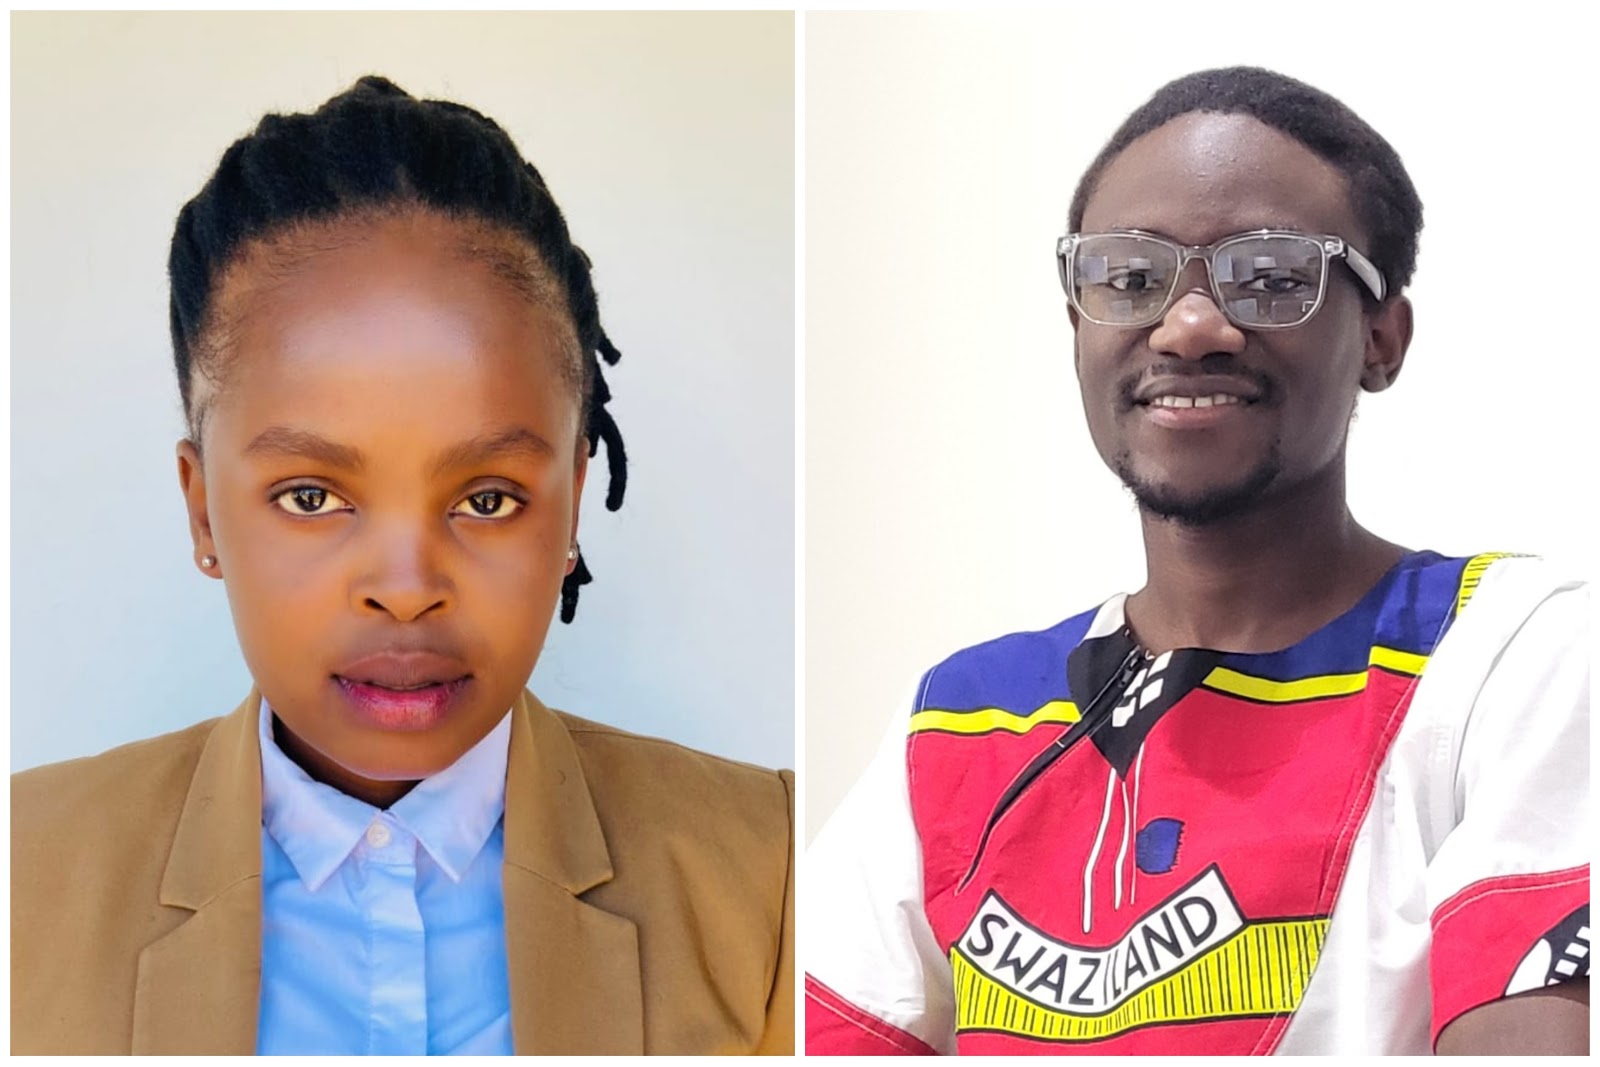
R Consortium recently caught up with Emmanuel Olamijuwon and Nontsikelelo Shongwe, organizers of the Eswatini R Users Group (Twitter: EswatiniUseR). They discussed how the R user base is growing in Eswatini and how the pandemic has affected them. (Eswatini is located in southeastern Africa, surrounded by South Africa and Mozambique.) Although the COVID pandemic really affected their community, the group is gearing up to restore the former status quo before the pandemic hit.
What is the R community like in Eswatini?
The R community in Eswatini is expanding significantly, and we are optimistic it will continue doing so. Apart from tertiary students and the corporate world, there have been calls for adoption and use of Free and Open-Source Software in teaching and learning in Eswatini’s secondary and high school. This is perhaps the reason behind the growth of the R community in the country.
How has COVID affected your ability to connect with members?
The COVID pandemic has greatly affected us. We haven’t been able to meet physically because of the restrictions that came with the pandemic. Having virtual meetings has also been impossible due to limited internet connectivity — not everyone has internet access because of the cost — and for those with internet access, the speed is slow.
In the past year, did you have to change your techniques to connect and collaborate with members?
The Internet has always been a challenge that’s why we haven’t been able to use any online platforms, such as GitHub or Zoom. We have only used WhatsApp, but only for the organizers so we could share important communications.
Can you tell us about one recent presentation or speaker that was especially interesting and what was the topic and why was it so interesting?
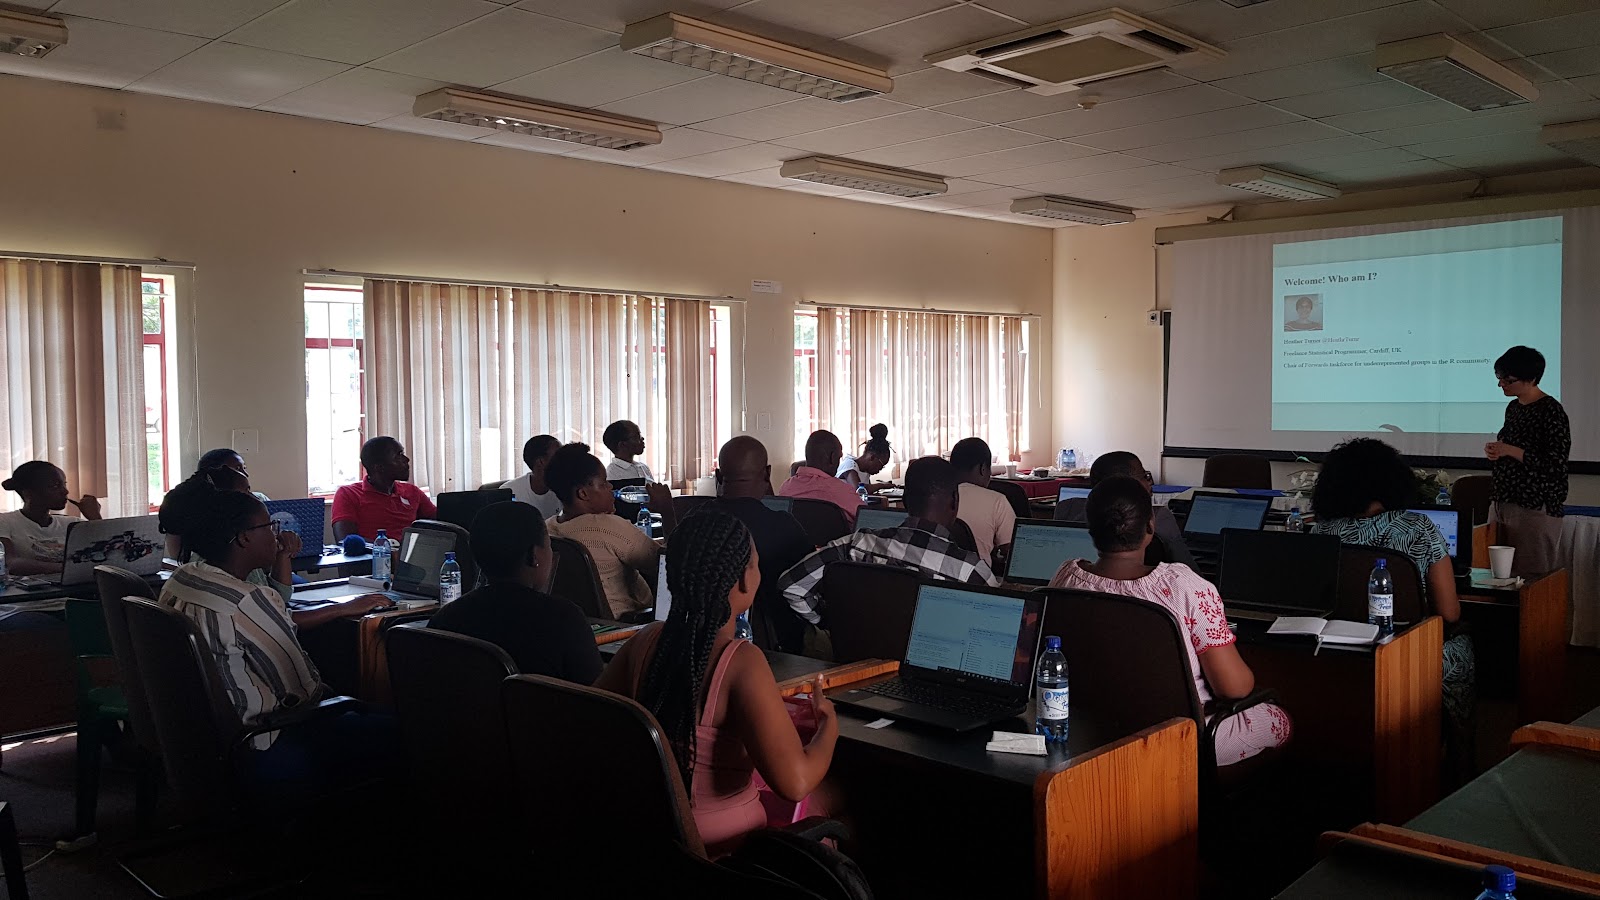
We had Heather Turner do a presentation on diversity and inclusion in R. It was exciting to see what R-Ladies community groups are doing and how we fit in as a community.
What trends do you see in R language affecting your organization over the next year?
I am not sure if this is a trend, but I would love to see R incorporated with Python. Not necessarily to see which language is better but in order to get maximum results from the two.
Do you know of any data journalism efforts by your members? If not, are there particular data journalism projects that you’ve seen in the last year that you feel had a positive impact on society?
Currently not really any. However, we heard in the local newspaper of an initiative UN Eswatini was running to educate journalists in the country about data journalism. That’s the only data journalism project we have heard about.
Emmanuel: I love the Setting up an R-Girls Schools Network project. It is my favorite probably because I joined the R community through R-Ladies South Africa. I had gone to one of their meetings and one of the organizers advised me to start an R-User group so I started. I love its goal which is to increase representation and participation of girls in R. This happens to be one of the things I would love to see as well.
Nontsikelelo: My favorite is R/Pharma. It is my favorite because it focuses on easening decision-making environments and health technology assessment for Health Analysts through utilizing R.
When is your next event? Please give details!
We are still in talks with other organizers when we can have our next meeting.
The rOpenSci project, a developer collective that develops tools and fosters community to enable open science with R, is hiring a new community manager. rOpenSci is an avenue recruiting new talent into the R ecosystem and a hotbed of experimentation of approaches to package design and infrastructure for R. Our work is only as strong as our community, though, and the community manager plays the central role in bringing in new members, fostering collaborations, and maintaining the welcoming and positive experience that keeps that community strong. Thanks to an award from the Chan-Zuckerberg Initiative, this position will help lead a new program to recruit and support open-source leaders from historically underrepresented communities, working with affinity groups like Minorities in R, LatinR, AfricaR, R community, and R-Ladies.