The R Validation Hub – a working group established within the R Consortium to support the adoption of R within a biopharmaceutical regulatory setting – held a two-part mini-series about their {riskmetric} package and {riskassessment} application.
The full talk is available here. Part 2 is available here.
In Part 1, the R Validation team talked about defining risk in software quality. Equally important is understanding the intended use of the software. The {riskmetric} package fulfills the crucial need to assess the quality of R packages, ensuring they adhere to the highest standards.
{riskmetric} isn’t just a tool; it’s a comprehensive system. For users, it provides a well-defined workflow and offers insights into the package’s internals, aiding in understanding its functioning better.
Mapping the Future – Roadmap:
The {riskmetric} package is being actively worked on and improved. The major features in the upcoming roadmap include:
Ease of Use: The focus is on enhancing user experience. A more intuitive interface coupled with informative messages and functions to generate straightforward reports is on the horizon.
Metric Completion: The goal is to provide many metrics from various package metadata sources.
Optional Third-party Metric Inclusion: An API that supports metrics reliant on additional packages, giving users a choice to use them.
Cohorts: Evaluating the risk associated with a group of packages, treating them as a unified entity.
Metrics aren’t just about numbers; they’re about quality and relevance. In the talk, the team shed light on the guidelines and best practices for proposing or designing package metrics, complemented with examples for clarity.
Introduction of {riskscore}
The team introduced {riskscore}, a repository that stores the results of riskmetric runs on CRAN. It is envisioned as a community resource with multiple aims:
Contextual Scoring: Helping users decipher scores, distinguishing between what’s deemed “good” or “bad.”
Benchmarking: Enabling development teams to benchmark scoring weight algorithms with historical results.
Trend Analysis: create an interesting dataset for package quality/risks analysis.
The Berlin R User Group fosters a diverse and vibrant R community in Berlin. Rafael Camargo shared some insights from his experience regarding the potential of R and some anecdotes for organizers of RUGs. The Berlin RUG is currently looking for sponsors to host their physical events, and companies interested in hosting the group can contact Rafael.
The group is hosting a physical event using R for spatial data analysis on September 26, 2023.
Rafael is a Spatial Data Scientist working at Quantis as a Sustainability Expert. He has a Bachelor’s in Environmental Studies and a Master’s in Environmental planning.
Please share your background and involvement with the RUGS group.
I was first introduced to R during my Master’s studies in 2016. A Ph.D. student encouraged me to use R for data analysis, and I grew fond of it.
Later, during my Master’s thesis, I used it as well. After completing my Master’s degree, I used to work for WWF, a nature conservation organization. My responsibilities included maintaining a web tool and conducting spatial analysis.
In my job, I noticed repetitive tasks which I found tedious. I started automating tasks and report generation using R Markdown and, later, Quarto to reduce repetition. I am one of the early adopters of Quarto and heavily use it for my work. I work for a consultancy firm, and again, with a strong focus on automating processes. I use Notebooks in my work for documentation and reproducibility.
Can you share what the R community is like in Berlin?
The R community in Berlin is very welcoming and has this spirit of helping each other. I joined the Berlin RUG around the same time I started using R. The group hosted monthly meetings with talks on a diverse range of topics by speakers from industry, academia, and freelancers. Some speakers offered courses in R and used this opportunity to market their courses while giving back to the community.
Just before COVID hit, there was a shift towards machine learning topics. I think this shift mirrored the industry’s growing interest in machine learning applications. There are more speakers keen to give machine learning-related talks. The audience also grew, and we saw more people joining our meetups who were new to R but eager to learn about machine learning.
Within our group, we see members from diverse backgrounds. For example, small financial institutions use R to optimize interest rates through bank APIs, professionals in biomedicine doing statistics, health insurance exploring spatial analysis, and experts in real estate using R for house price prediction.
Overall, it’s a pleasant mix of academia and applied industry. Companies using machine learning are considering R for industry applications.
I’m particularly excited about our upcoming meetup on Spatial Data Science with R. I’ve been advocating for this topic. We’re fortunate to have Edzer Pebesma, a prominent developer and maintainer of various R packages for spatial analysis. He’ll deliver a talk at the end of September, covering material from his latest book, “Spatial Data Science using R,” and the latest advancements in the field. And, of course, leveraging the packages he has developed over the years.
Any tips you would like to share with other R Users Group Organizers that can be helpful for hosting successful events?
I can share a few insights from my experience as a RUG organizer. When I joined as a participant, our meetups were hosted at a company-sponsored venue with a dedicated room accommodating up to 50 people. They also generously provided drinks and snacks for the participants.
After joining the organizing committee, I learned about the company’s flexibility and willingness to accommodate our event requests. We were somewhat reactive, with potential speakers approaching us with proposed dates, and we coordinated with the company to find a suitable date. I would negotiate with the speaker to ensure the talks were concise, with enough time for discussion.
Fortunately, the company managed the event logistics, including venue and refreshments, so my role was minimal. However, they stepped down as sponsors last year after COVID-19, and we are actively seeking new sponsors. This has been particularly difficult due to our busy schedules. So, I would recommend organizers be more proactive in reaching out to sponsors and not rely on only one sponsor.
Additionally, I would like to take this opportunity to reach out to any companies in Berlin who can offer us space to host our events.
Would you like to add anything else for the readers?
In the past 5 years, engaging with several global organizations and multinational corporations, I realized that many organizations outside the research, software development, e-commerce, or marketing domains also rely heavily on data-driven solutions. However, I see a lack of awareness among organizations about the true potential of R. Many people are surprised to know that R can be used for domains beyond statistics when I talk about my work with R. Many global organizations still rely on manual work using Excel, which is much prone to errors. They are unaware of R’s capabilities and recent developments. I wish more people knew about the user-friendly functionalities of Tidyverse, Posit Connect, and other tools available in R.
Round two is here! The R Consortium Infrastructure Steering Committee (ISC) orchestrates two rounds of proposal calls and grant awards per year to fortify the R ecosystem’s technical infrastructure. We have one key goal: to make meaningful infrastructure improvements that serve the R community.
We’re reaching out to the extended R community to tap into your expertise and insights. What areas do you think need attention to extend R’s capabilities? Do you see emerging domains where R could significantly impact? Whether in Climate Science, Engineering, Finance, Medicine, or any other discipline, your ideas could spark innovations that advance the field and broaden the R community.
Technical Infrastructure projects that have been funded include:
R-hub is a centralized tool for checking R packages
Testing DBI and improving key open-source database backends.
Ongoing infrastructural development for R on Windows and macOS
Social Infrastructure projects include:
SatuRDays bootstrapping a system for local R conferences.
Data-Driven Discovery and Tracking of R Consortium Activities
The ISC is interested in projects that:
Are likely to have a broad impact on the R community.
Have a focused scope (a good example is the Simple Features for R project). If you have a larger project, consider breaking it into smaller chunks (a good example is with the DBI/DBItest project submission, where multiple proposals came in overtime to address the various needs).
Have a low-to-medium risk with a low-to-medium reward. The ISC tends not to fund high-risk, high-reward projects.
Key Dates for 2023
Second Grant Cycle: September 1 to October 1, acceptance by November 1, contract by December 1.
Review Process
The Chair of the ISC and committee members will review all proposals. Results will be announced as per the schedule above, and all funded projects will feature on the R Consortium blog.
Final Thoughts
Let’s enrich the R landscape, amplifying its utility across various sectors. The time is ripe, and your ideas could be the seeds of transformation. We look forward to your active participation.
Apply now and be part of shaping the future of R! You can read more about ISC Grant Proposal application process here.
Ivan Millanes from the R en Rosario recently talked to the R-Consortium. He shared the group’s vision to create an inclusive knowledge-sharing platform for a diverse R community in Rosario. In Argentina, the group welcomes participants and speakers at all experience levels. Ivan also uses R at work and builds Shiny applications for the pharmaceutical industry.
Ivan co-organizes R en Rosario and is one of the group’s founding members. He completed his Bachelor’s in Statistics at the National University of Rosario. Not to mention, Ivan has achieved multiple certifications in Machine Learning. Currently, he works as a R/Shiny developer at Appsilon.
R en Rosario First Anniversary Celebrations
Please share your background and involvement with the RUGS group.
My educational background is in Mathematics and Statistics. I first used R around six years ago during my studies and have since gained experience in R through different jobs. I have worked in various industries like marketing, healthcare, and insurance. I am currently working in the Pharmaceutical industry.
R en Rosario Founding Members
We started the R en Rosario User Group a couple of years ago, Argentina’s first R User Group. Later, other cities also started their R Users Groups, e.g., Buenos Aires. We hosted a few virtual meetings during the pandemic but stopped after a few months. Now that everything is returning to normal, we plan to resume our meetings. We would like to host speakers from different industries who use R for their work. A networking session would follow these talks.
R en Rosario First Meeting
What industry are you currently in? How do you use R in your work?
I currently work in Pharma, where we develop Shiny applications using R.
The applications we develop have a similar workflow: we connect to SQL databases and produce some outputs the business needs in the form of PDFs or Word documents based on user choices for different parameters.
We use the Rhino package from Appsilon to develop the applications, as it provides a great framework for developing high-quality applications. We also use:
R Markdown and officer to generate PDF and Word reports from the app
One application we developed generates annual reports of different incidents in the laboratory. Before we developed the application, this process was manual and took time. With this app, they have a relatively simple interface where they can select the data they want to see in the report. They can download the reports and also get it sent to their system.
Why do industry professionals come to your user group? What is the benefit for attending?
People from a diverse range of backgrounds attend our meetups. Some government officials use R to analyze traffic data for public services. Some people from the farming industry use R to interpret satellite images to understand crops.
Even though statisticians founded this group, its purpose is to provide a platform for people from various backgrounds to learn R and use it for their work. We usually have around 20-30 people attending our meetups, and different companies provide space to host our meetups.
Networking is an important part of our meetups, allowing members to learn more about each other.
We also do not have any limit on the topics for these talks, and anyone who feels like sharing their work in R with the audience can give a talk. So everyone, at any experience level, is more than welcome to give a speech. We are not experts and are not looking for only experts to give talks. The idea is for people from different backgrounds to come together and learn from each other.
Motivated by the growth of the R Consortium over the past several years and the expansion of activities, the R Consortium Board of Directors has taken a step to ensure long-term, consistent oversight of day-to-day activities.
The R Consortium is pleased to announce that Joseph Rickert has been appointed to the position of Executive Director reporting directly to the Board of Directors.
Joseph has been active in the R Community since he joined Revolution Analytics in 2009 and has held prominent, community-facing positions at both the R Consortium and RStudio (now renamed posit). He is deeply involved in multiple R Consortium technical working groups, is an organizer of the Bay Area useR Group (BARUG), and has been on the R/Medicine conference organizing committee since the first conference in 2018. Joseph served on the R Consortium Board of Directors from August 2016 to July 2023, serving as Chair from 2020.
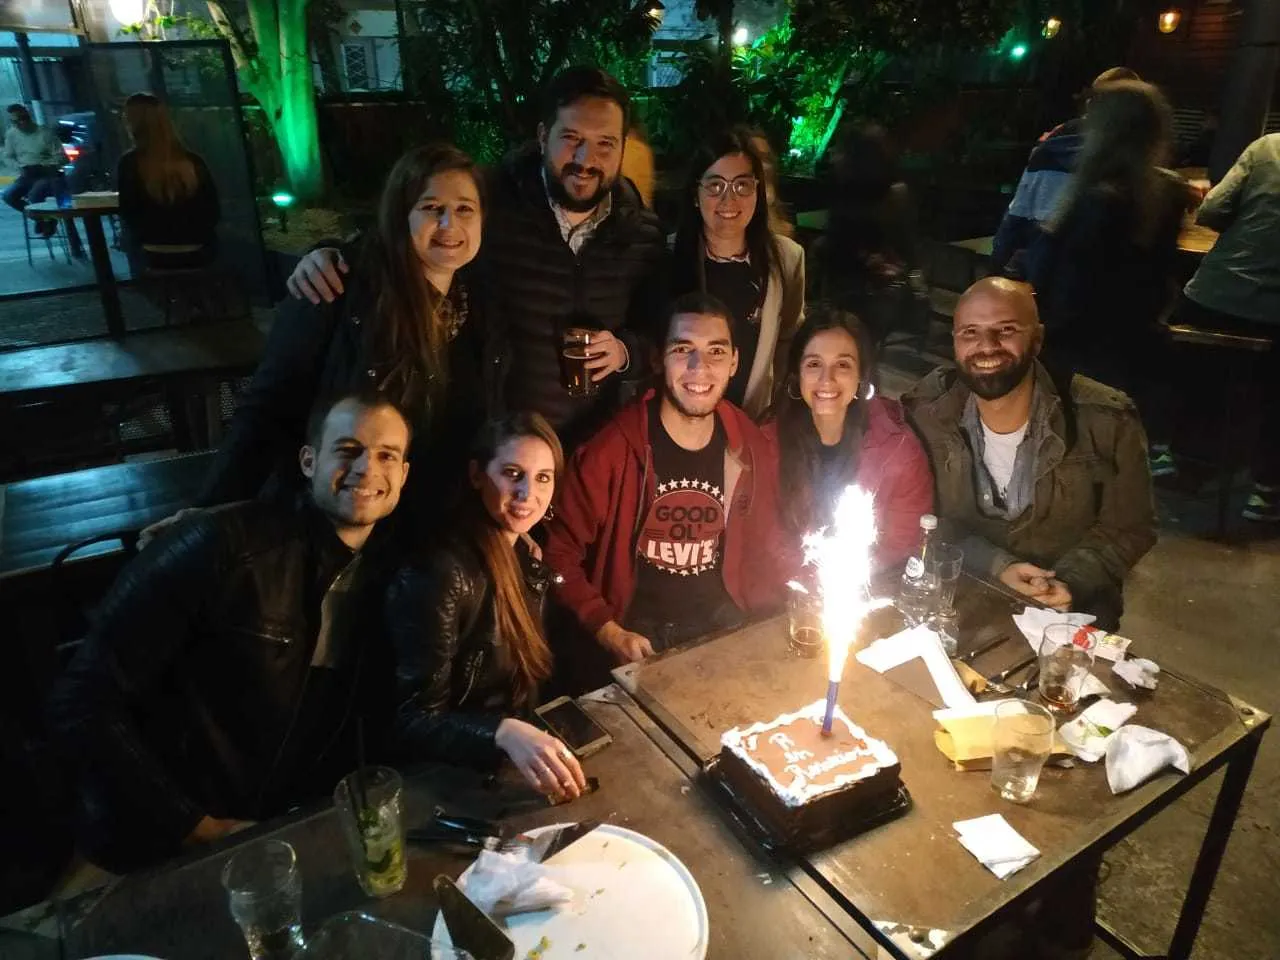
R-Ladies Morelia is celebrating its first anniversary on the 31st of July 2023, and hosting a hybrid event to mark this occasion. In this event, they plan on providing the Center of Mathematical Science at UNAM with an analysis of their recruitment, graduation, and research data.
Nelly Sélem, co-founder and organizer of the group also discussed the group’s rapid growth over the course of a year. She also shared how she uses R for her work as a bioinformatics researcher.
Please share about your background and involvement with the RUGS group.
I am a professor at the Center for Mathematical Sciences at UNAM in Morelia, Mexico. I earned a degree in Mathematics from the University of Guanajuato and a master’s degree from CIMAT. Then, I did a Ph.D. and a Post-doctorate in Integrative Biology at the Evolution of Metabolic Diversity lab at Langebio-Cinvestav. I care about teaching. I have taught at prestigious México Universities: UNAM, ITESM, IPN, and CINVESTAV. I contributed to the educational community by developing a metagenomics open-source lesson in “The Carpentries Incubator.” I’m a founder member of BetterLab, a biotechnology and software startup, and I’m also a member of the Mexican SARS-CoV-2 Genomic Surveillance Consortium.
As a scientist, I have proposed and developed bioinformatics solutions to biological problems of comparative genomics of microorganisms. I am interested in the genome evolution of Archaea, Bacteria, and Fungi.
I founded the R Ladies Morelia chapter with Haydee and Claudia last year. We try to organize meetings every month more or less. And this year on our first anniversary we plan to hold a big annual meeting in which we will get to meet more people.
Can you share what the R community is like in Mexico?
I can only talk about the R Ladies chapters in Mexico, as I am more familiar with them. We have several chapters in Mexico and each year there is an annual meeting for all cities.
The Mexico City and Cuernavaca chapters are rather big. I would say, overall, there is a lot of interest on social media and members of R-Ladies chapters are inviting other girls to learn to code.
Our chapter is also growing rapidly as we started with four members and now we have a stable community. On the best days, we have up to 90 people attending our events but on average we have between 12 to 20 attendees.
Most of the R-Ladies chapters in Mexico are being run by people from academia and sponsored by universities. I do know that some of us work in the area of bioinformatics and Bioconductor.
We are also close to the international R community because we are following the R Champions program. I think it’s for Latin America and we are trying to get connected with that program.
For this meetup, which is also our first anniversary, we plan on giving the Center of Mathematical Science, National University of Mexico an evaluation. It would include a comparison of the number of students being graduated each year and the quality standard of researchers against other universities from Mathematics in Mexico and Latin America. The center has sponsored us for the past year, and it is going through the process of becoming a bigger institute.
With this event, we are trying to give back to the center with data analysis of its basic statistics. The audience will learn to use dataframes and ggplot to visualize data. We will be working in teams to teach basic ggplot visualizations. And on the second day, we will be giving small workshops and sharing our work with each other. All our events are Hybrid so this one is also going to be Hybrid and people will attend both physically and virtually.
We hope to grow our community through this event and also contribute to the annual report of the Center of Mathematical Sciences.
Any techniques you recommend using for planning for or during the event? (Github, zoom, other) Can these techniques be used to make your group more inclusive to people that are unable to attend physical events in the future?
Meetup has been very helpful for keeping everything organized, and we use Zoom for our virtual meetings. We also share code through our GitHub repo and people can go back to it after meetings. For communication between organizers, we mostly use WhatsApp chat.
At the start of the semester, we plan events for that semester with dates, speakers, and topics to be covered. We work in teams, so we can help each other. Sometimes we go through chapters of a book, or we just go for an R package. We consider ourselves a community of practice. Even if people don’t know a lot, we do some data analysis and share the code on the meeting day.
Please share about a project you are currently working on or have worked on in the past using the R language. Goal/reason, result, anything interesting, especially related to the industry you work in?
I would like to mention MetaEvoMining, a project one of my undergrad students is working on for his thesis. We are trying to treat metagenomic data in order to look for some gene families that are going through expansions. And maybe these expansions conduce to recruitment into antibiotic gene producers. So we are looking for something different in gene families that may be recruited to new antibiotic gene families. This has been researched in genomes but not in metagenomes and there is a lot more data available in metagenomes. We want to develop an R package for this purpose. For the project, we are using Posit (RStudio). We are also using packages like ggplot and RString. We are also using tidyverse in general.
This is a guest post by Joseph Korszun, Senior Manager of Data Solutions at ProCogia. ProCogia is a member of the R Consortium. Joe is a data scientist with a background in mathematics and engineering. He is passionate about using statistical analysis to improve business decisions by developing scalable and flexible solutions that solve complex problems.
Introduction
New York City, known for its vibrant energy and thriving tech scene, became the epicenter of data and analytics during the recent NYC-R Conference. As an avid data enthusiast, I couldn’t resist the opportunity to immerse myself in this bustling conference and gain valuable insights into the world of R and Python programming.
I had the pleasure of representing ProCogia and the R-Consortium. The experts who stood before us showcased their deep knowledge and dedication to advancing data science. It was remarkable to see people so passionate about the R programming language and its applications in the field. Throughout the event, they engaged the audience with informative presentations and interactive workshops, sparking insightful discussions among attendees. The positive reception from the crowd highlighted the significance of collaboration and knowledge-sharing in the data science community. I was inspired by their expertise and left the conference with a renewed enthusiasm for data science and the possibilities it offers. The event provided a fantastic opportunity to connect with like-minded professionals and learn from the best in the industry. I am grateful for the experience and eagerly look forward to seeing more contributions in the future. In this blog post, I will share my experiences attending the NYC-R Conference and highlight some key takeaways that left a lasting impression.
Pre-Conference: Workshops at NYC-R
The NYC-R Conference’s workshops promise a thrilling exploration of diverse data science topics using the power of R programming. Attendees will embark on an immersive journey to delve into essential areas of data science, including time series forecasting, machine learning, Bayesian data analysis, and causal inference. Industry experts led these workshops offer a unique opportunity to expand data science expertise and harness the true potential of R in driving data-driven innovations. Some of the below workshops were provided in the first two days of the NYC-R Conference:
Tidy Time Series and Forecasting in R by Michell O’Hara-Wild
Machine Learning in R by Max Kuhn
Bayesian Data Analysis and STAN by Jonah Gabry
Causal Inference in R by Malcolm Barrett and Lucky D’Agostino McGowan
Day 1: An Exciting Kickoff
The conference commenced with an invigorating address, highlighting the growing significance of R in the industry and the importance of fostering its continued development. The vibrant atmosphere was infectious as I was surrounded by like-minded individuals who shared the same passion for data science.
The day was packed with informative sessions covering a various of topics, from advanced data visualization techniques to machine learning algorithms.
Day 1 of the NYC-R Conference featured diverse and insightful presentations, showcasing the remarkable potential of the R programming language in data science. Attendees explored various topics, including transitioning to Quarto for interactive data reports, building R packages with LLMs, and making impactful design decisions for statistical software visualizations. The presentations also delved into data-driven marketing channel attribution, the power of OpenAI’s Embeddings API, and the art of creating captivating presentations through Slidecraft. Experts from NFL Next Gen Stats revealed the many models powering sports analytics, underscoring the transformative role of data science in the sports industry. The conference left attendees inspired and equipped with valuable skills to drive data- driven innovation in their fields.
The Importance of Continuous Learning
Day 1 of the NYC-R Conference was a remarkable showcase of the importance of continued learning and the incredible potential of the R programming language. As data enthusiasts gathered, the conference provided a platform for exploring various facets of R and its impact on data-driven decision-making.
The NYC-R Conference became a hub of knowledge sharing and collaboration, where data professionals engaged in vibrant discussions and exchanged ideas. This collaborative environment emphasized the significance of staying updated with the latest trends in data science to remain at the forefront of innovation.
Day 2: Unlocking Data Insights through Advanced Analytics
Day 2 of the NYC-R Conference was a captivating journey into the forefront of data science. Attendees were treated to lectures and presentations that showcased the latest advancements in the field. The exploration of Bayesian Boosting revealed its potential for predictive modeling, offering a fresh perspective on data analysis techniques.
In an enlightening presentation, a renowned data science expert delved into the importance of democratizing data access in the session “An Ode to Permissionless Data Science.” This inspiring talk encouraged attendees to foster a more inclusive and collaborative data science community, empowering data professionals to drive innovation together.
Participants were enthralled by demonstrations of LLM use, equipping them with practical skills to build robust R packages. The “How to Make Decisions with Data” session, empowered attendees to derive meaningful insights, ensuring data-driven strategies and informed decision-making.
The day continued with captivating lectures that covered various data science aspects, concluding with a live episode of the SuperDataScience Podcast. The podcast provided invaluable industry insights and sparked engaging discussions, leaving attendees inspired and eager to apply their newfound knowledge in their data-driven endeavors. Day 2 at the NYC-R Conference left participants with a deeper understanding of data science’s evolving landscape, motivating them to make a lasting impact in the dynamic world of data-driven innovation.
Language Wars Still at Large
Wes McKinney, the brilliant mind behind pandas, addressed the ever-lingering “Language Wars” in the data science realm. With a focus on breaking down barriers and fostering interoperability, McKinney unveiled how Apache Arrow and the Python Polars library are revolutionizing the data stack. Attendees were enthralled by McKinney’s insights on harnessing the power of these cutting-edge tools to streamline data operations, improve performance, and enable seamless data exchange across programming languages. As the discussion unfolded, it became evident that the quest for data-driven excellence continues, and the open-source community remains at the forefront of bridging the gap between programming languages for the betterment of data science.
The Power of Community
The conference highlighted the power of community in the world of data science. Interacting with professionals from diverse backgrounds provided fresh perspectives and insights, fostering an environment of collaborative learning and growth. As a sponsor member of the R-Consortium, ProCogia extends its heartfelt gratitude for their invaluable support in making this event possible. Their commitment to advancing the R programming language and data science community has been instrumental in creating a vibrant platform for knowledge sharing and networking. The connections made during the NYC-R Conference are a testament to the strength of this community, forming the foundation for future collaborations and knowledge sharing that will undoubtedly drive data-driven innovations for years to come. ProCogia is proud to be part of this thriving community and looks forward to continuing its involvement in fostering growth and innovation within the R community.
Conclusion
Attending the NYC-R Conference was an exhilarating and enlightening experience. The conference reiterated the widespread adoption of R as a powerful tool in data science. Numerous presenters showcased their impressive projects and highlighted the versatility of R in data analysis, modeling, and visualization. It became evident that R is not just a programming language but an entire ecosystem that supports data-driven decision-making across various domains.
The conference showcased the immense potential of R in data science, emphasized the importance of continuous learning, and highlighted the value of community and collaboration. As I left the conference with a wealth of new knowledge and connections, I felt inspired to apply what I had learned in my own data-driven endeavors. The NYC-R Conference not only expanded my horizons but also reinforced my passion for the exciting world of data science.
Dorota Rizik of the R Ladies New York recently talked to the R Consortium about the diverse R community in New York. She also discussed how her current job at a non-profit organization involves training her colleagues to use R. She shared details of some of the packages they have developed for internal use.
Dorota has done her Bachelor’s in Psychology from Northwestern University and also completed her Master’s in Applied Statistics from New York University. She currently works as a Technical Research Analyst at MDRC.
Please share about your background and involvement with the RUGS group.
My background is in psychology and policy research. I currently work at a nonprofit social policy research organization. I learned R during my Master’s in Applied Statistics and then I joined my current organization. When I joined, MDRC was primarily using SAS and over the past couple of years they’ve been transitioning to R because it’s open source. My role has been to train my colleagues in the R programming language. So I train them on how to use R and also how to do specific data-related tasks like data cleaning, data analysis, or data visualization in R.
Our focus has been on building both training and guidance for using R for various use cases. We have been working on developing internal functions and packages that staff can use to help automate certain tasks. We have been trying to replace all of the macros and functions we previously developed in SAS. So we have been translating a lot of code from SAS to R.
It’s just been a wonderful experience to help organize these meetups for R Ladies of New York City. I’ve learned how to organize and communicate, as well as how to adapt to a changing audience and community. So it’s been a very challenging, but rewarding experience.
Can you share what the R community is like in New York?
In our group, we have people from both the private and public sectors. We have someone who works at 1-800-Flowers. We have someone who works in the political space doing analysis for political campaigns or getting voters registered. There are folks that work in media and journalism and the pharmaceutical industry. There are some people who have gotten higher-level degrees.
It’s just such a wide range, and it’s been very eye-opening to interact with all these people who come from such different backgrounds. It has also been eye-opening in the sense that I have realized that I can really take my skill set and apply it to any industry. R programming and programming knowledge in general, as well as data analysis knowledge can be used in many different industries.
Please share about a project you are currently working on or have worked on in the past using the R language. Goal/reason, result, anything interesting, especially related to the industry you work in?
We are currently wrapping up two major packages, one focuses on analysis, and the other focuses on tabling. The packages are for internal use and not publicly available. Our staff prefers having all the analysis results in one place, so we have been working on that. We have different basic statistical functions like linear regression, chi-square, etc., but we have written them together so that they can produce a nice table of results. The package focused on tabling will interact with the analysis package to create a table of results.
What trends do you currently see in R language and your industry? Any trends you see developing in the near future?
Recently there’s been more talk about ethics and reproducibility. AI has made a huge impact and has been a major consideration for people within my company as we are talking about how to train people in R programming. We want to be mindful that some folks will probably use AI for coding help, but it doesn’t necessarily give you the most efficient answer. So, a major trend in our meetups has been AI and the ethical considerations of relying on AI for developing your code.
Any techniques you recommend using for planning for or during the event? (Github, zoom, other) Can these techniques be used to make your group more inclusive to people that are unable to attend physical events in the future?
We use Zoom for our meetups and Zoom has been incredibly helpful in the sense that it has allowed us to tap into a wider audience. I’ve noticed we have people who don’t live very close to New York City but are still in the relative area and they join our meetups. So that’s been a significant benefit.
The only downside has been that we get some uninvited people joining and disrupting our meetups. So I would suggest that groups hosting online meetups try to come up with ways to minimize the possibility of strangers joining their meetups. We’ve taken the approach of having a separate sign-up form where you have to provide your first and last name and your email. We’ve also tried not sharing the Zoom link until the last minute before the meetup. So a mix of those two approaches has been helpful.
I’ve noticed more of an interest in physical meetups now. We’ve been online for a while at this point. So we’re trying to find the right balance of which meetups are more appropriate for physical versus online.
Get Involved!
The 2023 RUGS Program is currently taking applications and will close at midnight PST on September 30, 2023.
These grants do not include support for software development or technical projects. Grants to support the R ecosystem’s technical infrastructure are awarded and administered through the ISC Grant Program which issues a call for proposals two times each year.
Andy Thomason, code performance consultant and lecturer at the University of London covering programming, physics and AI courses focused on game development, created an open source project to add Rust’s performance, reliability, and productivity to R. Andy created the Extendr package, a safe and user-friendly R extension interface for using Rust. The project was supported by a grant from the R Consortium.
Extendr is a toolkit for building extensions to R using Rust. R users can add high performance features to R without having to worry about crashes due to segmentation faults and other problems associated with C and C++. Extendr manages the lifetime of wrapped R objects so that they are available for garbage collection when they reach the end of their life.
Rust is extremely user-friendly and has been voted one of the most loved languages on Stack Overflow for several years.
By joining R with Rust, Extendr makes it possible to write packages and small functions in Rust. What problem are you solving by doing this?
The integration of R and Rust through Extendr addresses a specific challenge encountered by individuals with an R background when it comes to writing code in languages like C and C++. While R users often face difficulties when working with C or C++ code, Rust offers a more accessible and streamlined alternative, focused on multi-threaded programs. The package is meant to help simplify the process from R to Rust.
What sort of use cases provided by R users helped with the design requirements?
I originally started working with a biotech start-up in Oxford, where most of their business logic was written in R. They were working on solving tricky problems with Bayesian Inference in particular. Bayesian inference is a method of statistical inference in which Bayes’ theorem is used to update the probability for a hypothesis as more evidence or information becomes available. I started coding C and C++ extensions to R to solve these problems using improved exponential functions.
For Bayesian Inference, you work in log space. Initially, I was using C++ but later the company I was working for started using Rust instead, and I started liking Rust. Using Rust, I was much more productive than with C++.
My interest then got me to study R internals to the point I could start writing something like this Extendr package. More people joined the community, brought things to it, and it has grown since!
As yet, we don’t have a large number of applications. It would be great if more people knew about and were involved in using this useful language.
If you want to consider using or contributing to Extendr, please contact us through Discord.
How did you get involved?
Having dedicated several years to working with Sony and the PlayStation consoles, I gained valuable experience in compiler development. Interestingly, my spouse, who is also a scientist, uses R. She often collaborates with colleagues learning to use Rust. Furthermore, we have friends who use R for drug trial designs, with a shared objective of cost reduction – drug trials are notoriously expensive.
Also of this means I looked into both programming languages, R and Rust. By utilizing R, significant time and financial resources can be saved. It inspired us to set out to build a bridge between Rust and R, leveraging the strengths of each.
Rust excels when dealing with vast amounts of data, and it proved to be exceptional for storing and retrieving multi-terabyte datasets. Rust acted as a powerhouse that facilitates data processing, while R empowered statisticians to draw meaningful conclusions and perform clustering analyses. In this symbiotic relationship, R served as the cognitive component, and Rust as the practical execution framework. The meticulous engineering nature of Rust ensured that everything aligned flawlessly, allowing R to seamlessly integrate and thrive in this cooperative ecosystem.
What are the next steps with the project?
Our contributors Hiroaki Yutani and Claus Wilke have put quite a lot of effort into plotting – there are also plans for 3D plotting. Ilia Kosenkov in Helsinki is the current maintainer and the project is very active. We also hope to release documentation in book form.
What do you do for your day job?
I am a consultant for a number of different industries. I also teach Rust programming to people all over the world like employees of Google and Fastly. Recently I have been consulting with a blockchain company about data organization and data-related problems. They use R for analyzing stock prices. I am also writing a book on Rust performance – making Rust go fast.
What non-project hobbies do you have?
Outside of my projects, I enjoy spending time with my kids, who provide plenty of entertainment. I also have a fascination with Soviet brutalist architecture, which I share with my son. We also find pleasure in exploring areas on the Thames near Oxford.
What was your experience working with the R Consortium? Would you recommend applying for a grant to others?
The process of working with the R Consortium was brilliant! It was a great project to dive into during my transition from employee to consultant. Some tasks were structured, while others allowed for experimentation and refining the project’s structure. Over the past year, we’ve seen increased interest, especially in the collaboration between Rust and R.
I highly recommend others apply for grants through the R Consortium to contribute to meaningful projects and join a supportive community.
About ISC Funded Projects
A major goal of the R Consortium is to strengthen and improve the infrastructure supporting the R Ecosystem. We seek to accomplish this by funding projects that will improve both technical infrastructure and social infrastructure.
After serving as chair of the board for the R Consortium and being involved in multiple R Consortium committees both on the technical and community development sides, as well as participating directly in R-focused events, webinars, and countless other R activities, Joseph Rickert is stepping away from the position. The board will be conducting elections to decide the next chair.
Joseph has been with the R Consortium since it was first conceived in 2014. His initial role was as Community Officer. In 2018, he began to also serve as Secretary. In 2019, he was elected chair of the board.
Thank you for your tireless interest in promoting R and supporting developers and user groups around the world who are working to improve the R programming language.